Fig. 11
Download original image
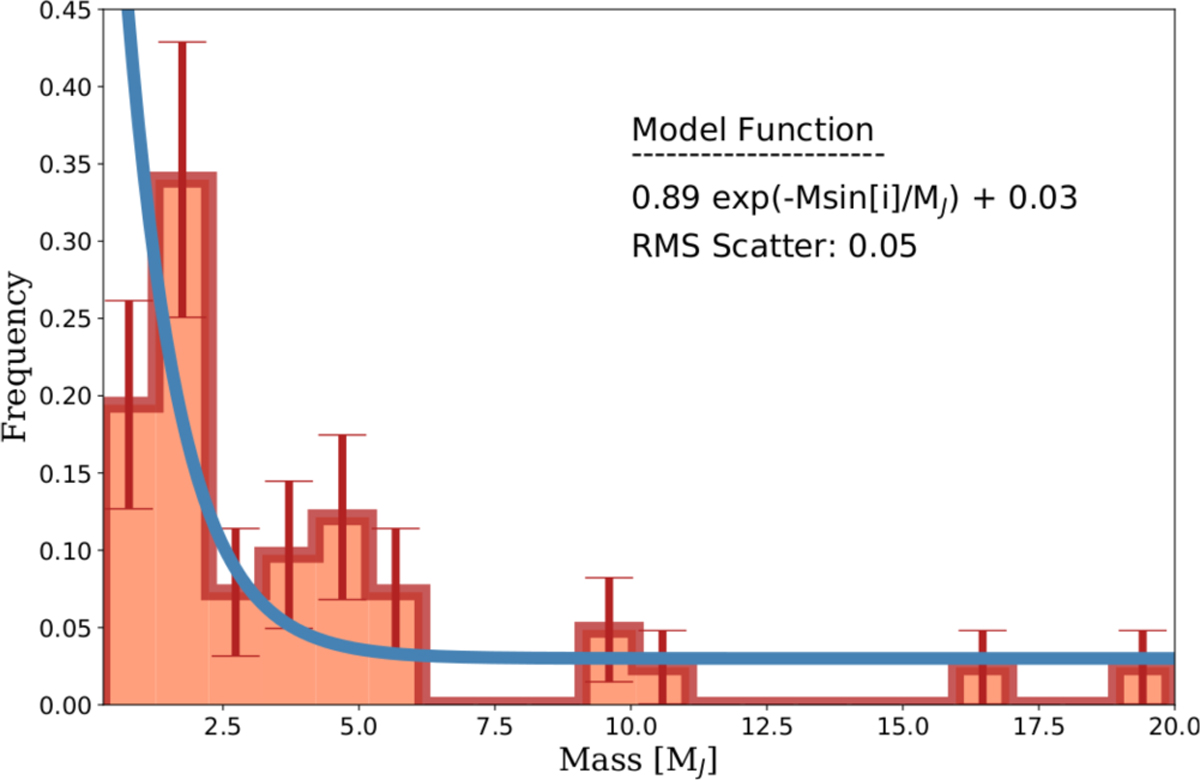
Histogram showing the normalised frequency of giant planets orbiting low-luminosity giant stars, including those discovered in this work. The associated uncertainties are drawn from Poisson statistics based on the individual counts within each bin. The navy curve represents the exponential mass function proposed in Jenkins et al. (2017) for the giant planet sample orbiting lower-mass stars on the main sequence, with the model parameters are RMS scatter around this model, excluding the heavily incomplete bin, shown in the plot. The planet candidates HIP 24275b & d, HIP 75092c, and HIP 90988b have been included in this analysis.
Current usage metrics show cumulative count of Article Views (full-text article views including HTML views, PDF and ePub downloads, according to the available data) and Abstracts Views on Vision4Press platform.
Data correspond to usage on the plateform after 2015. The current usage metrics is available 48-96 hours after online publication and is updated daily on week days.
Initial download of the metrics may take a while.