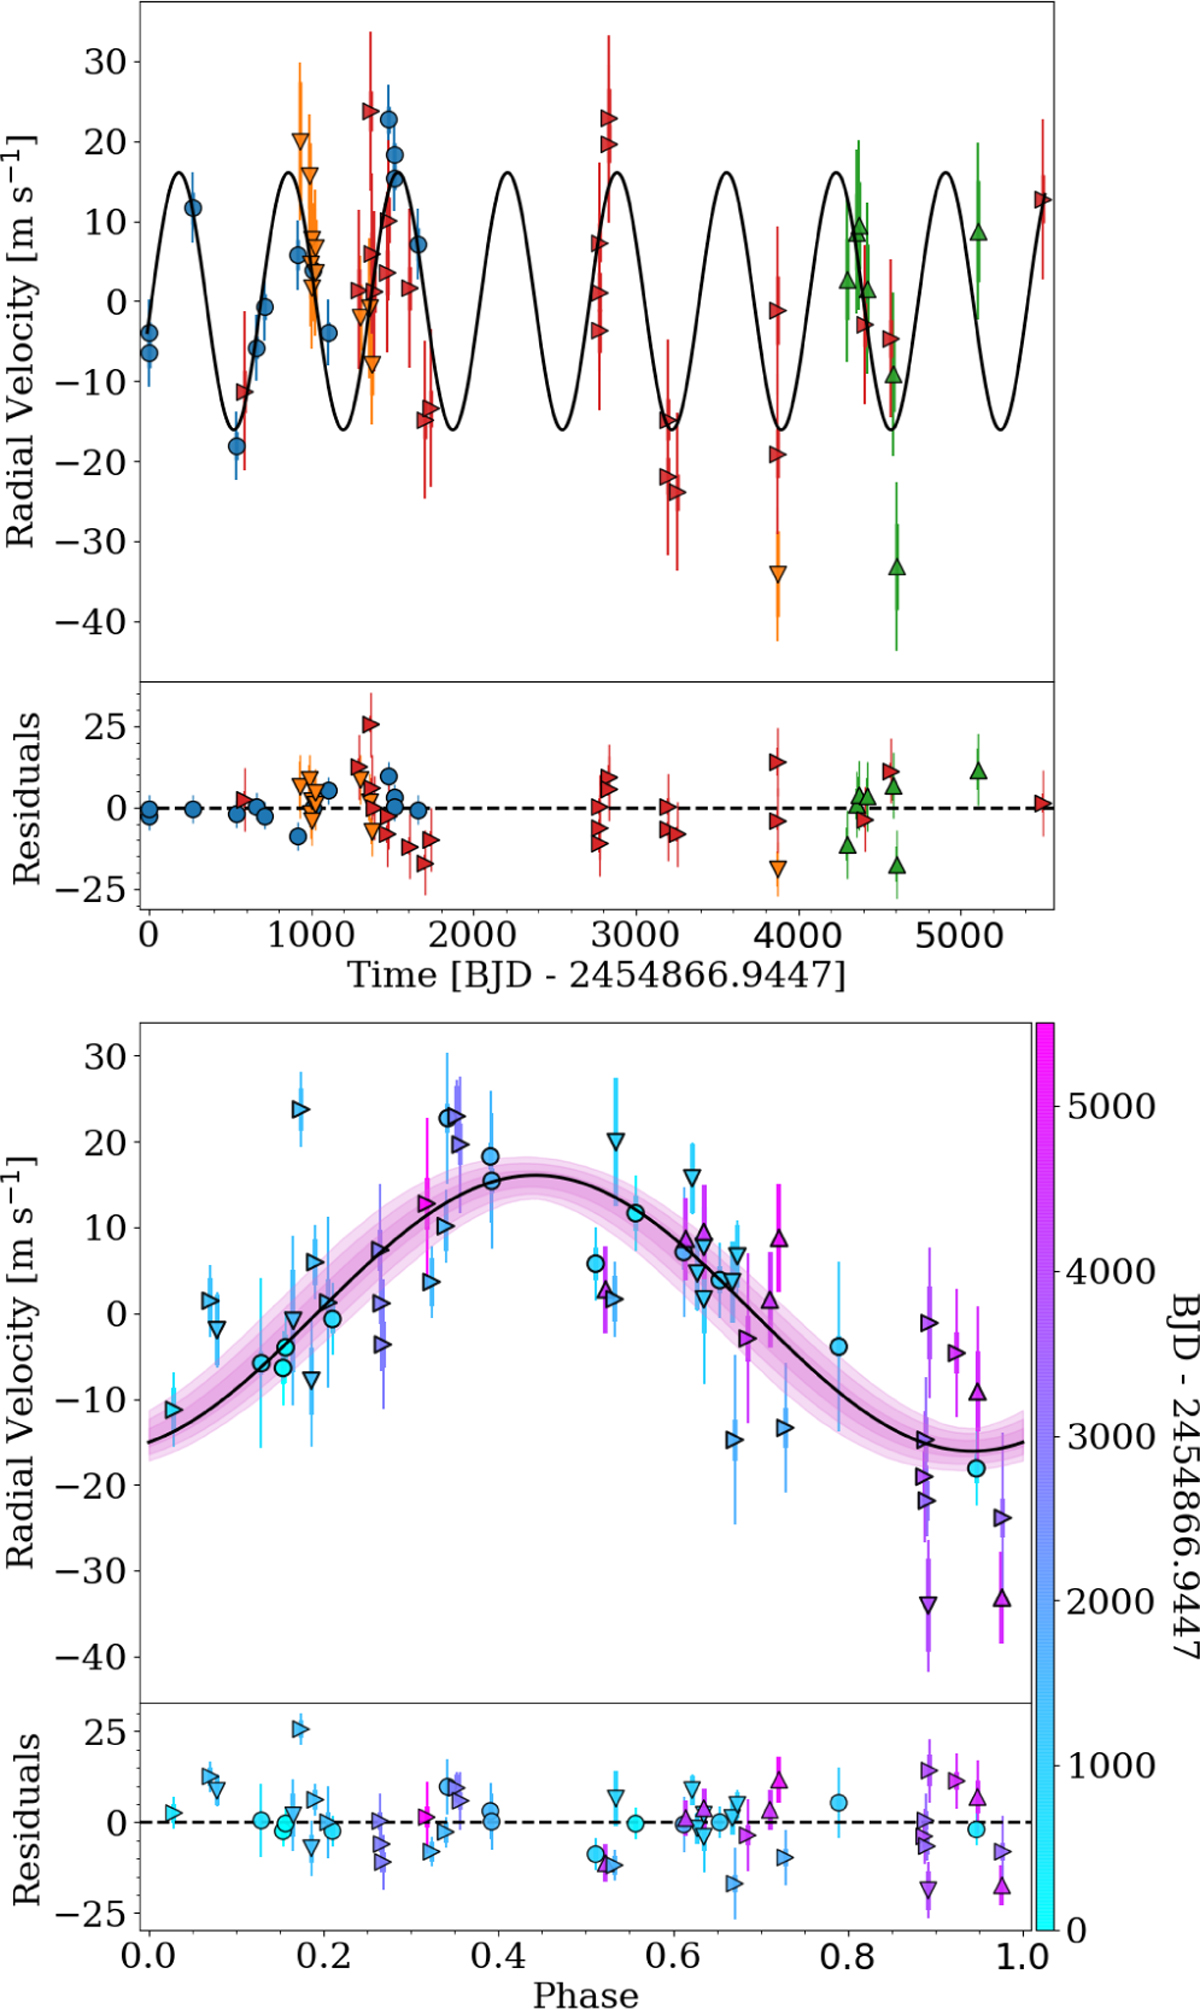
Fig. 2
Download original image
RV analysis for HIP 18606. Top panel: RV time series for data taken with UCLES (blue circles), FEROS (red tilted triangles), and the pre- and post-pandemic Chiron data (orange and green triangles, respectively) for HIP 18606. The best-fit Keplerian model is represented by the black curve. Lower panel: RVs phase folded to the period of the detected planet candidate. The symbols represent the same data; however, the points are coloured depending on their observing date (see colour bar at right). The pink contours around the best-fit Keplerian model in black delimit the 1,2, and 3σ spread taken from the Markov chains. Both plots refer to the overall most probable model, the fixed eccentricity model with a white noise model component only.
Current usage metrics show cumulative count of Article Views (full-text article views including HTML views, PDF and ePub downloads, according to the available data) and Abstracts Views on Vision4Press platform.
Data correspond to usage on the plateform after 2015. The current usage metrics is available 48-96 hours after online publication and is updated daily on week days.
Initial download of the metrics may take a while.