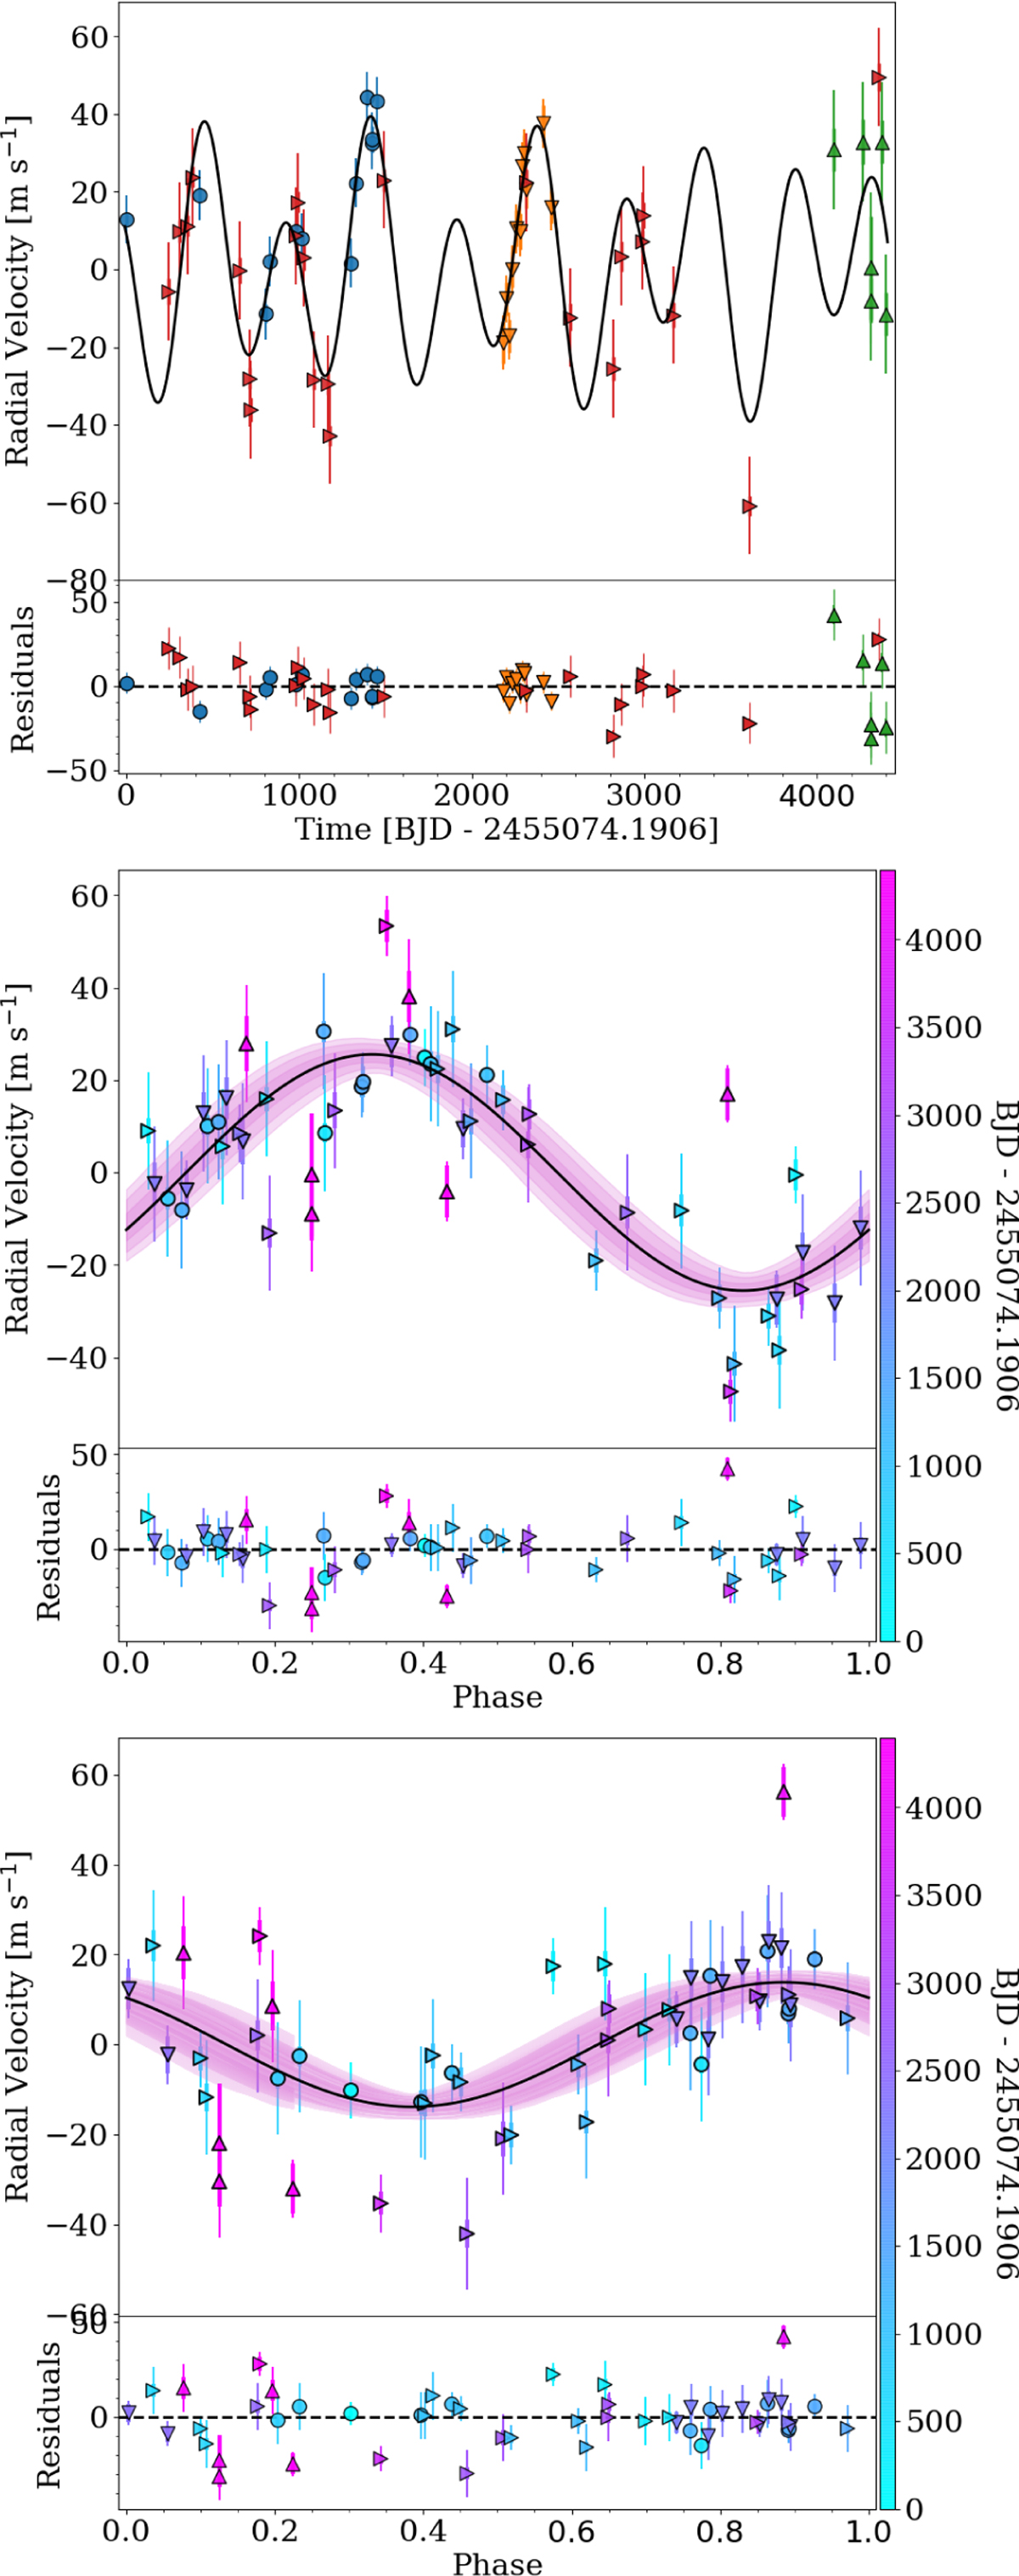
Fig. 3
Download original image
RV analysis for HIP 111909. The top panel of the upper plot shows the full time series RV data, including data from the UCLES (blue circles), FEROS (red tilted triangles), and Chiron pre- and post-pandemic (orange and green triangles, respectively), along with the joint best-fit Keplerian model (black curve) for HIP 111909. The lower panel here shows the residuals to this model fit. The centre and lower plots show the phase-folded signals detected by EMPEROR, along with the best-fit models shown in black, and the 1, 2, 3σ uncertainty bounds (pink shaded regions). The lower panels highlight the residuals to the model fits.
Current usage metrics show cumulative count of Article Views (full-text article views including HTML views, PDF and ePub downloads, according to the available data) and Abstracts Views on Vision4Press platform.
Data correspond to usage on the plateform after 2015. The current usage metrics is available 48-96 hours after online publication and is updated daily on week days.
Initial download of the metrics may take a while.