Fig. 6
Download original image
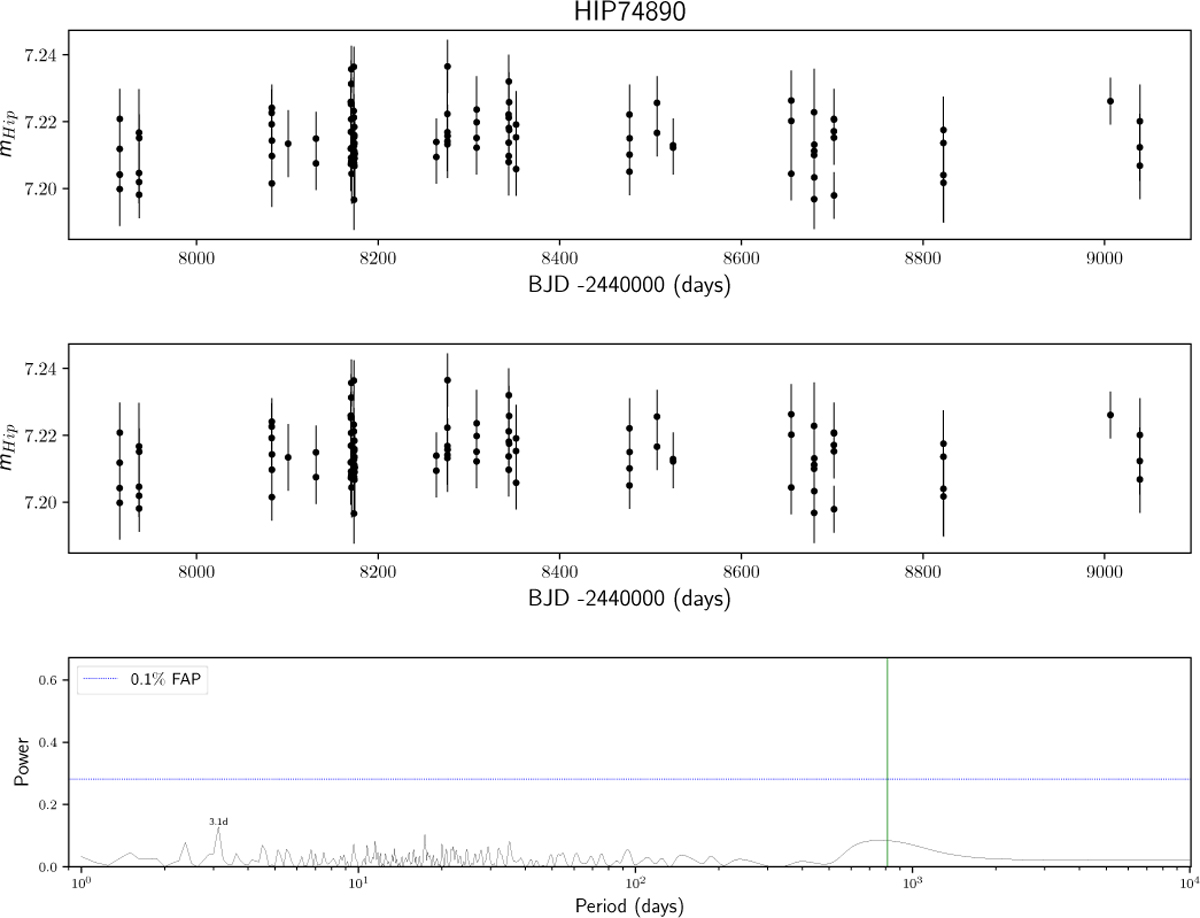
Hipparcos photometric data for HIP 74890 is shown in the top panel. The middle panel shows the cleaned Hipparcos photometry for HIP 74890. The generalised Lomb–Scargle periodogram of the photometry is shown in the bottom panel. The horizontal line corresponds to the 0.1% (dotted blue) FAP significance level computed via 5000 bootstrap iterations on the photometry time series. The vertical green line represents the periods of the planets.
Current usage metrics show cumulative count of Article Views (full-text article views including HTML views, PDF and ePub downloads, according to the available data) and Abstracts Views on Vision4Press platform.
Data correspond to usage on the plateform after 2015. The current usage metrics is available 48-96 hours after online publication and is updated daily on week days.
Initial download of the metrics may take a while.