Fig. 7
Download original image
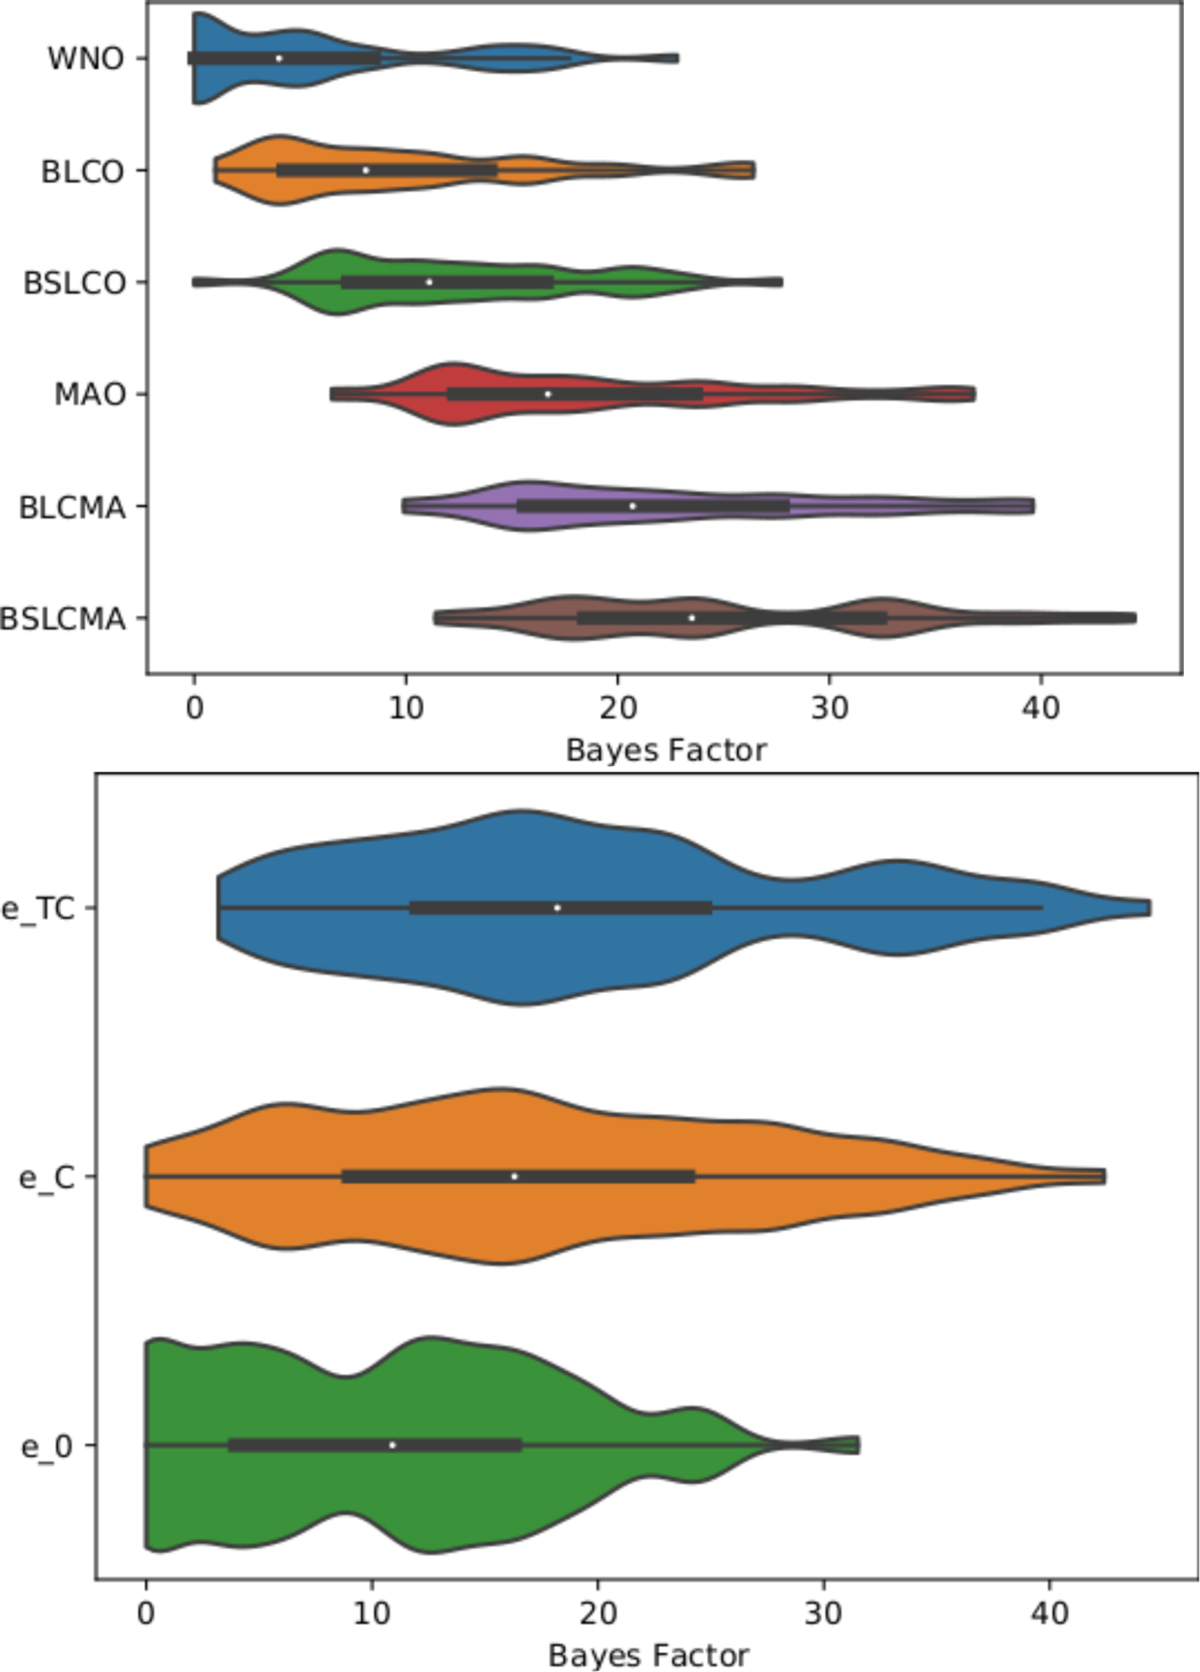
Performance analysis of our modelling grids. Top panel: violin plot of the distributions of the Bayes factors (ΔBICs) compared to the best fit for all models applied to each of the four realisations of the noise tested in this work. The blue curve represents the WNO models, the orange curve highlights the BLCO models, the green curve shows the MAO models, and the red curve the BLC+MA models. Lower panel: violin plot of the distributions of the same Bayes factors, but separated by the three eccentricity priors that were tested in this work. The blue distribution is for the eTC prior, the orange distribution is for the eC prior, and the green distribution is for the eF prior.
Current usage metrics show cumulative count of Article Views (full-text article views including HTML views, PDF and ePub downloads, according to the available data) and Abstracts Views on Vision4Press platform.
Data correspond to usage on the plateform after 2015. The current usage metrics is available 48-96 hours after online publication and is updated daily on week days.
Initial download of the metrics may take a while.