Open Access
Fig. D.1.
Download original image
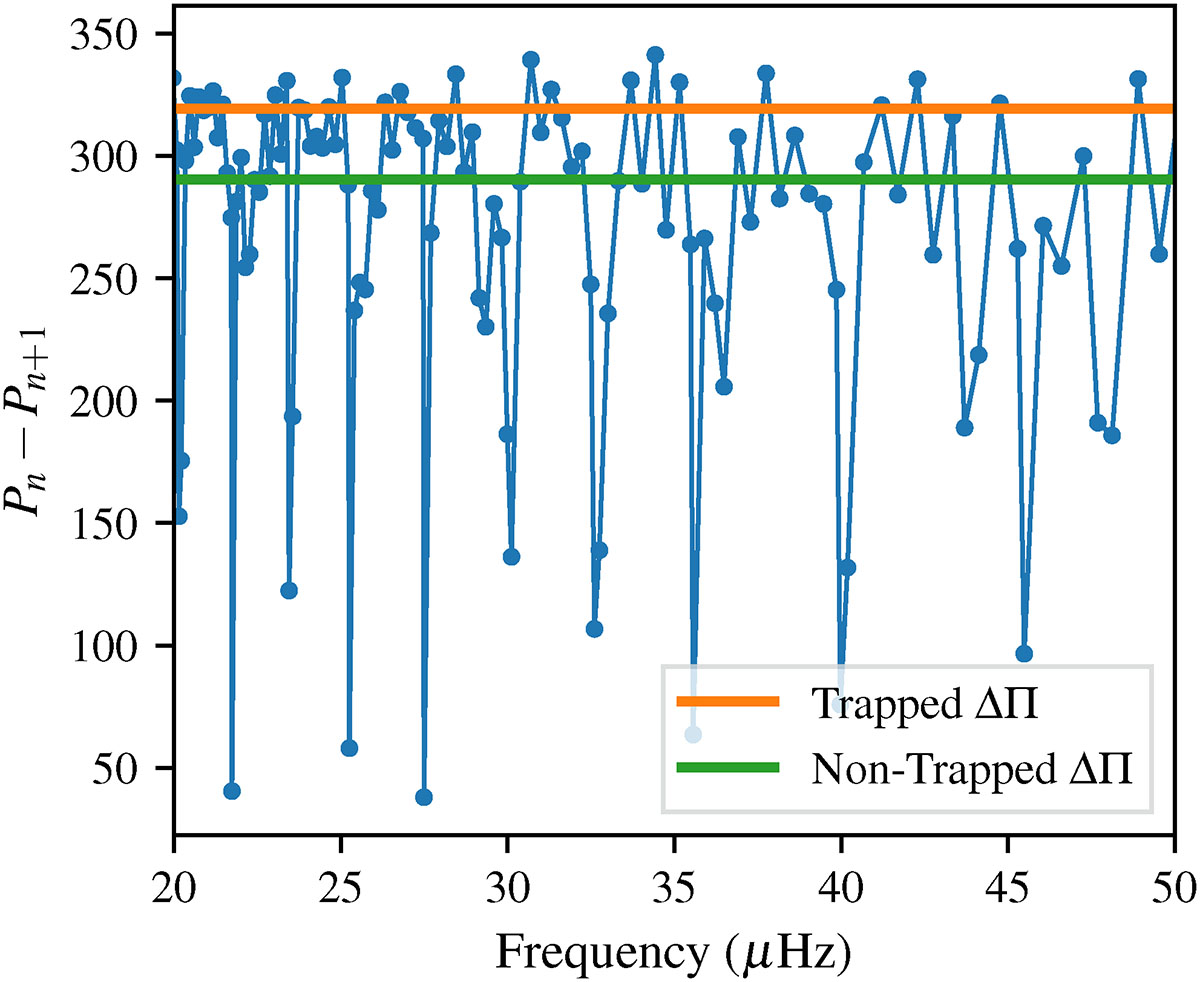
Consecutive period differences for a model computed with an overmixing scheme, terminated at Yc = 0.35. The asymptotic period spacing are represented by the horizontal lines, computed either in the non-trapping scenario (green) or in in the trapped scenario (orange).
Current usage metrics show cumulative count of Article Views (full-text article views including HTML views, PDF and ePub downloads, according to the available data) and Abstracts Views on Vision4Press platform.
Data correspond to usage on the plateform after 2015. The current usage metrics is available 48-96 hours after online publication and is updated daily on week days.
Initial download of the metrics may take a while.