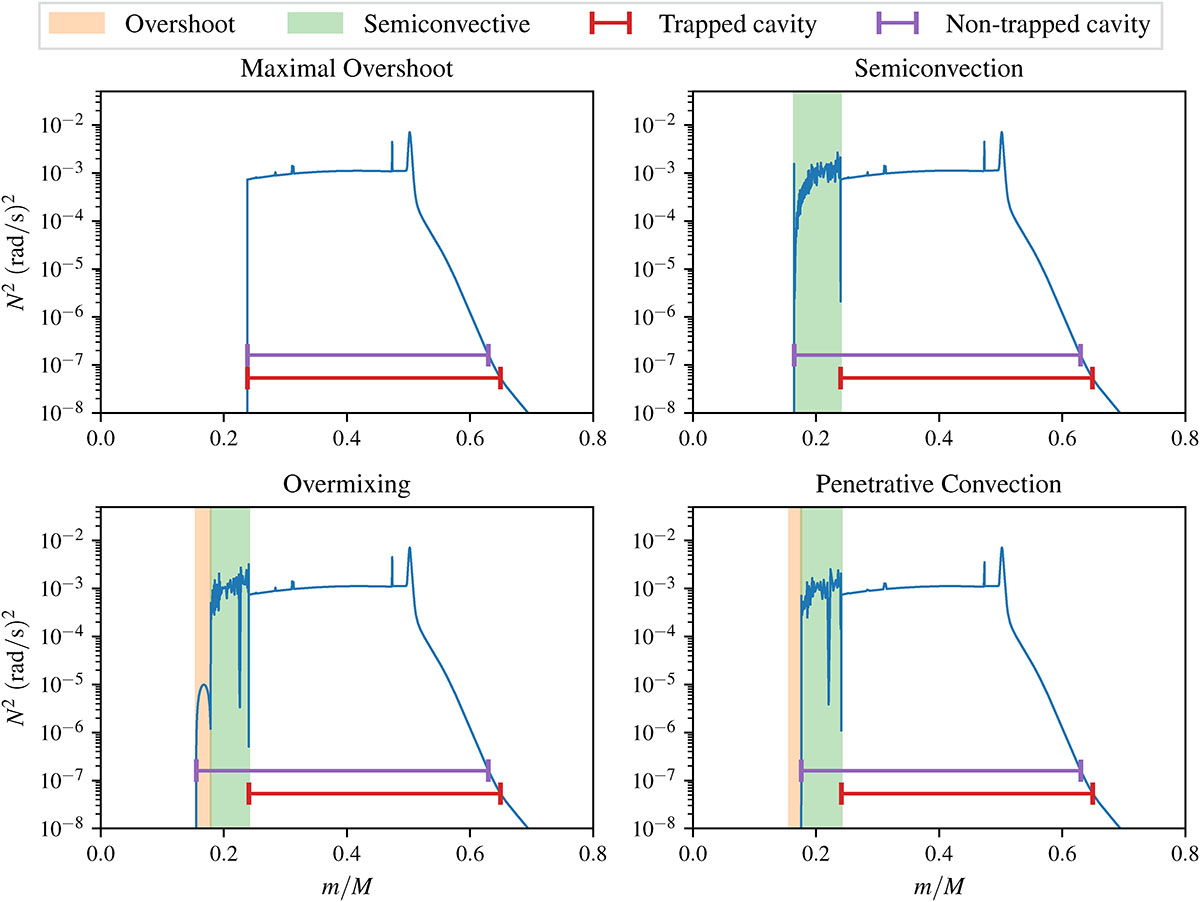
Fig. 2.
Download original image
Brunt-Väisälä profiles of four models with different CBM schemes, which were all stopped at Yc = 0.3. We indicate the overshoot region in orange, which is fully chemically mixed with the convective core. The region in green indicates the semi-convective region, where ∇rad = ∇ad. Finally, we indicate the region over which N/r was integrated in the trapped mode scenario (red) and in the non-trapped mode scenario (purple).
Current usage metrics show cumulative count of Article Views (full-text article views including HTML views, PDF and ePub downloads, according to the available data) and Abstracts Views on Vision4Press platform.
Data correspond to usage on the plateform after 2015. The current usage metrics is available 48-96 hours after online publication and is updated daily on week days.
Initial download of the metrics may take a while.