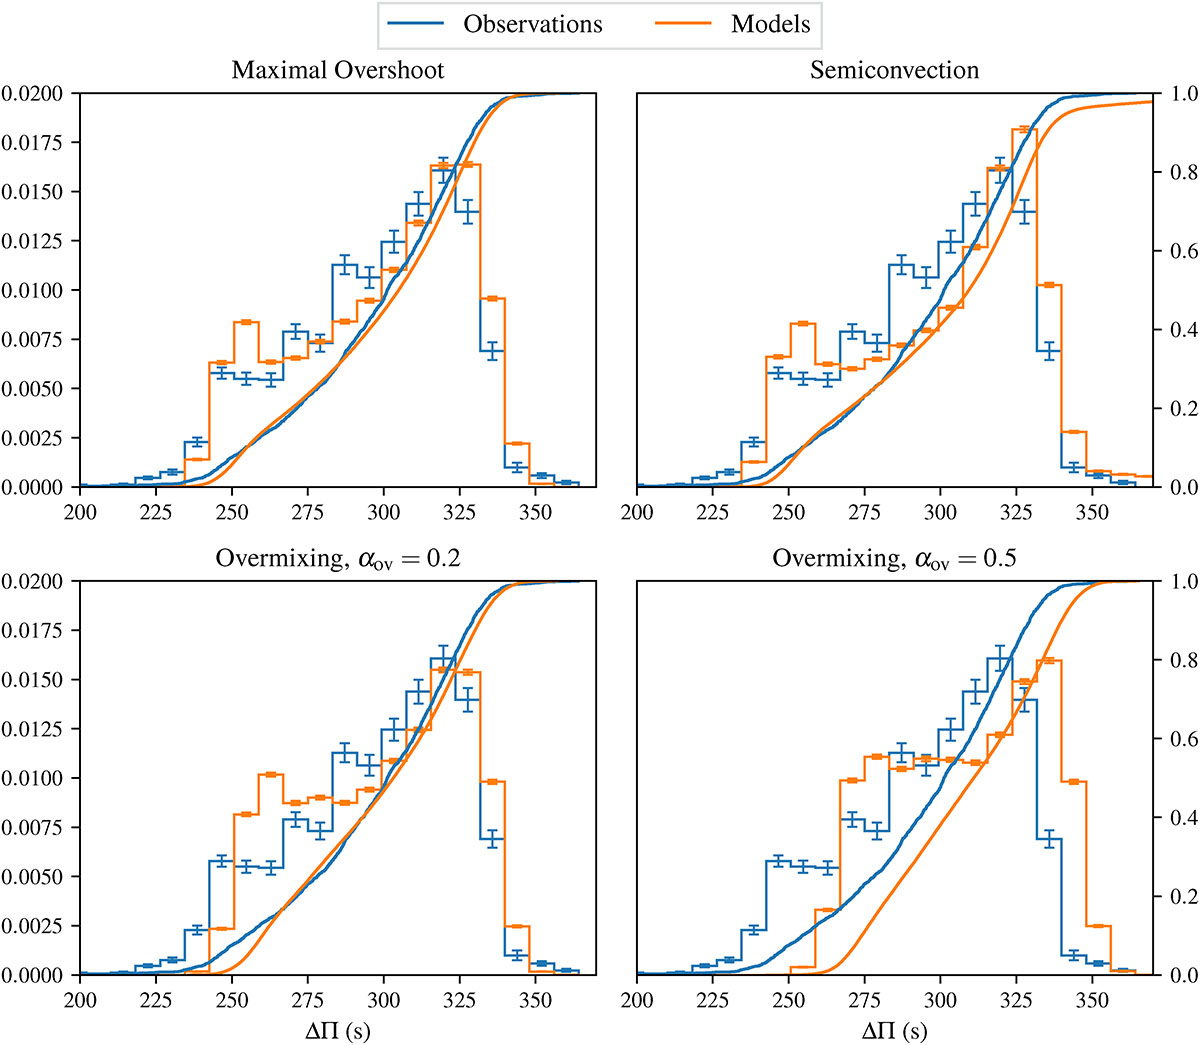
Fig. 6.
Download original image
Distributions of the computed values of period spacing (orange) and of the observed values of period spacing (blue), for models that assume mode trapping. The lines represent the corresponding cumulative distributions. The simulated distributions were computed using a maximal overshoot scheme (upper left), a semi-convection scheme (upper right), and an overmixing scheme with αov = 0.2 (lower left) and αov = 0.5 (lower right). The represented bin uncertainties for the observations were computed following the procedure explained in Appendix A. Each bin value and associated uncertainties were normalized, i.e., divided by the total count and the bin width.
Current usage metrics show cumulative count of Article Views (full-text article views including HTML views, PDF and ePub downloads, according to the available data) and Abstracts Views on Vision4Press platform.
Data correspond to usage on the plateform after 2015. The current usage metrics is available 48-96 hours after online publication and is updated daily on week days.
Initial download of the metrics may take a while.