Fig. 3
Download original image
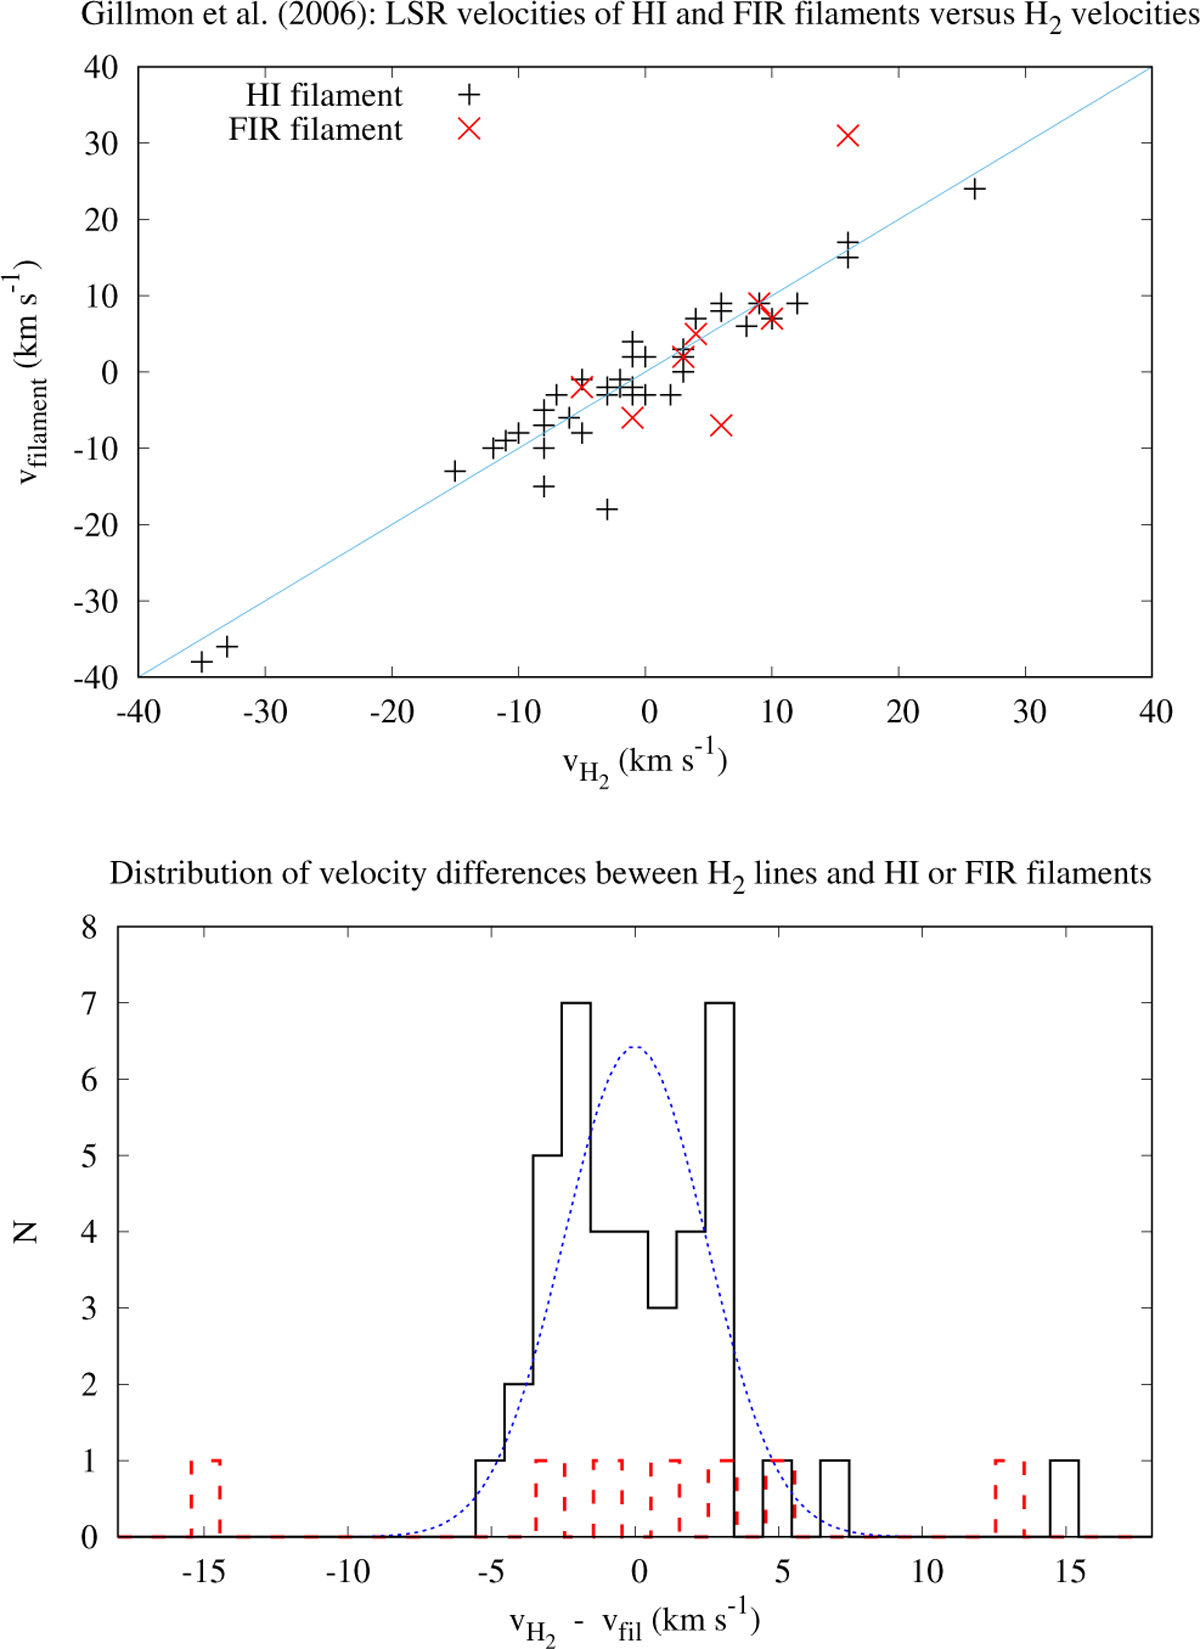
Comparison of velocities from H2 absorption and filaments in H I and FIR. Top: direct comparison between vH2 and filament velocities vHI (black) or vFIR (red) as defined in Sect. 2.1. Bottom: histogram of the velocity deviations ![]() for H I and FIR filaments. H2 data are taken from Gillmon et al. (2006). The dotted blue curve represents a reference distribution with
for H I and FIR filaments. H2 data are taken from Gillmon et al. (2006). The dotted blue curve represents a reference distribution with ![]() km s−1.
km s−1.
Current usage metrics show cumulative count of Article Views (full-text article views including HTML views, PDF and ePub downloads, according to the available data) and Abstracts Views on Vision4Press platform.
Data correspond to usage on the plateform after 2015. The current usage metrics is available 48-96 hours after online publication and is updated daily on week days.
Initial download of the metrics may take a while.