Fig. 10
Download original image
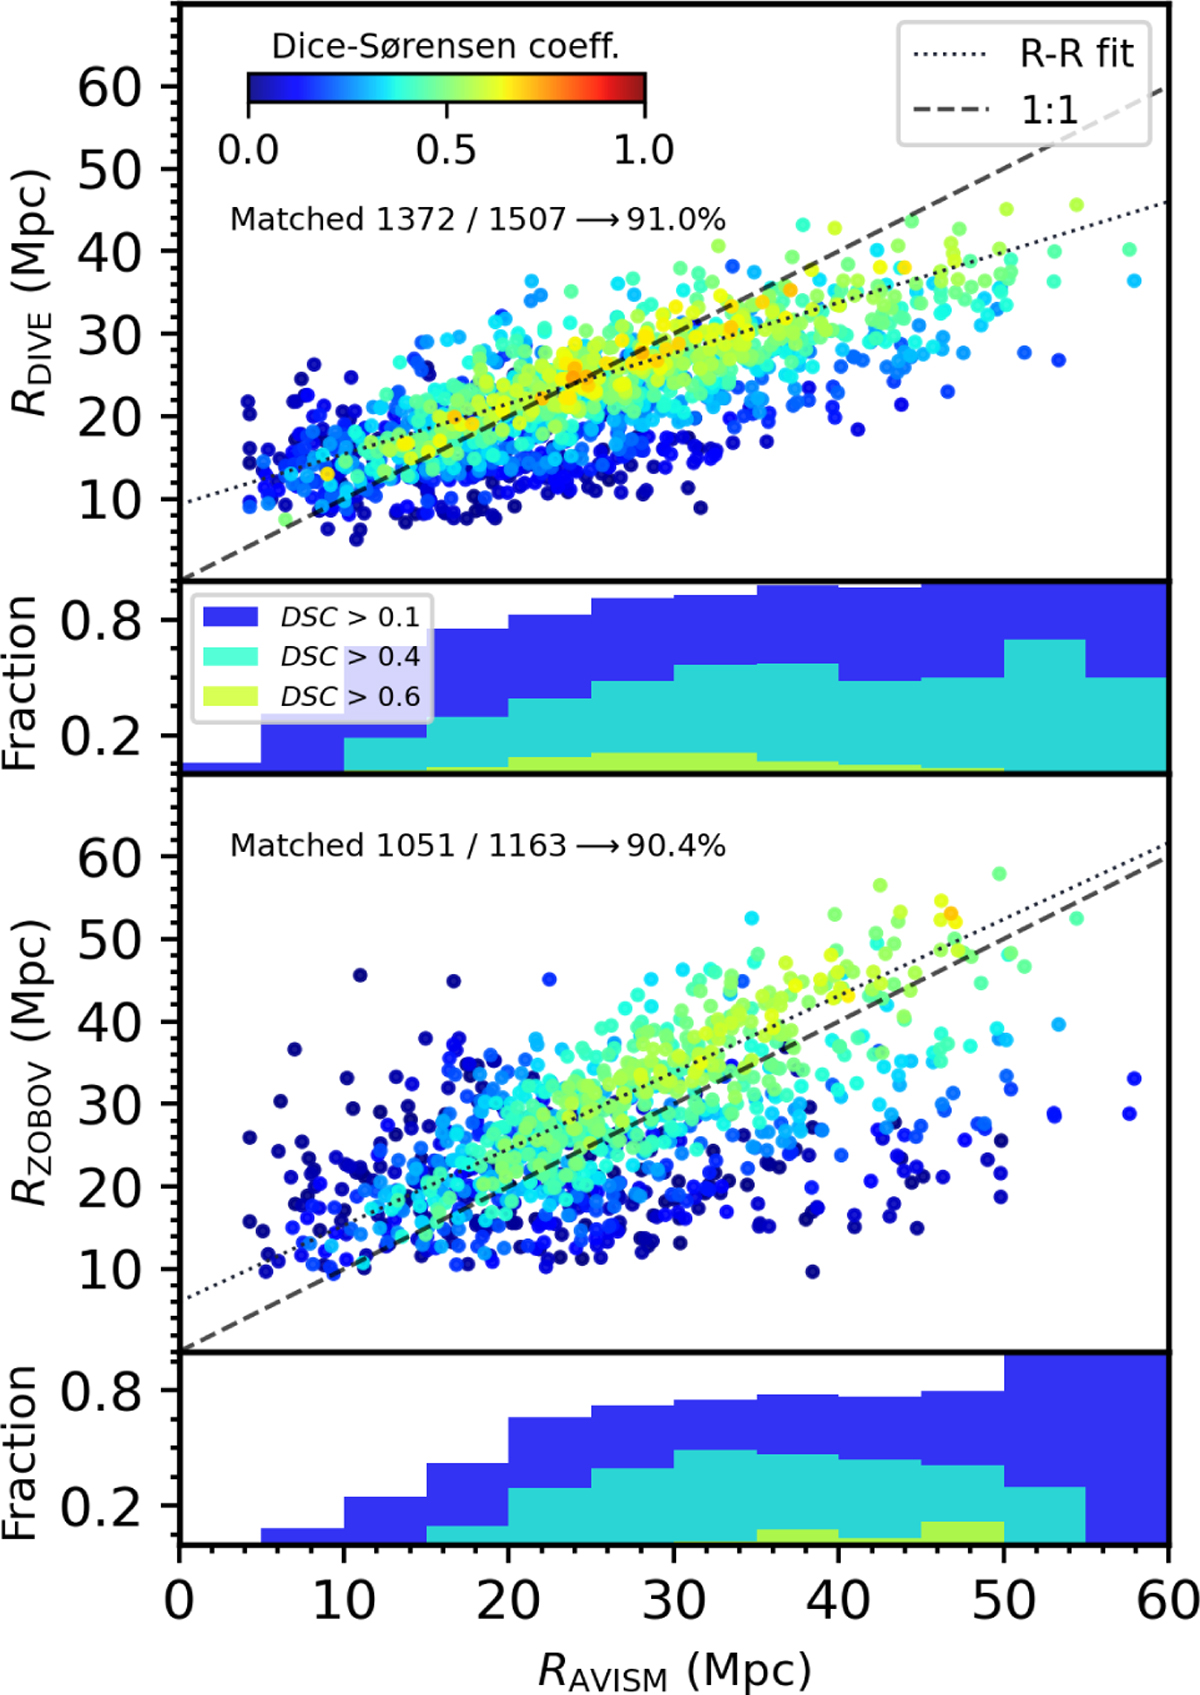
Cross-match between AVISM’s voids and those found by DIVE (top panel) and ZOBOV (bottom panel). For all AVISM voids, a point is drawn with the best match found in the other catalogues displaying, first, the colour-coded Dice-Sørensen coefficient for the match and, second, the radius of the corresponding counterpart on the vertical axis. The dashed black line shows the ideal case where the voids matched among the void finders have the same effective radius, whilst the dotted line displays a linear fit to the R − R relation, weighted by the DSC values. The small panels below each main panel show the fraction of voids for each radius that are matched with a DSC above a certain value, given by the different colours displayed in the palette. Redder (bluer) colours indicate higher (lower) DSC, meaning that the matched voids are more similar (different).
Current usage metrics show cumulative count of Article Views (full-text article views including HTML views, PDF and ePub downloads, according to the available data) and Abstracts Views on Vision4Press platform.
Data correspond to usage on the plateform after 2015. The current usage metrics is available 48-96 hours after online publication and is updated daily on week days.
Initial download of the metrics may take a while.