Fig. 5
Download original image
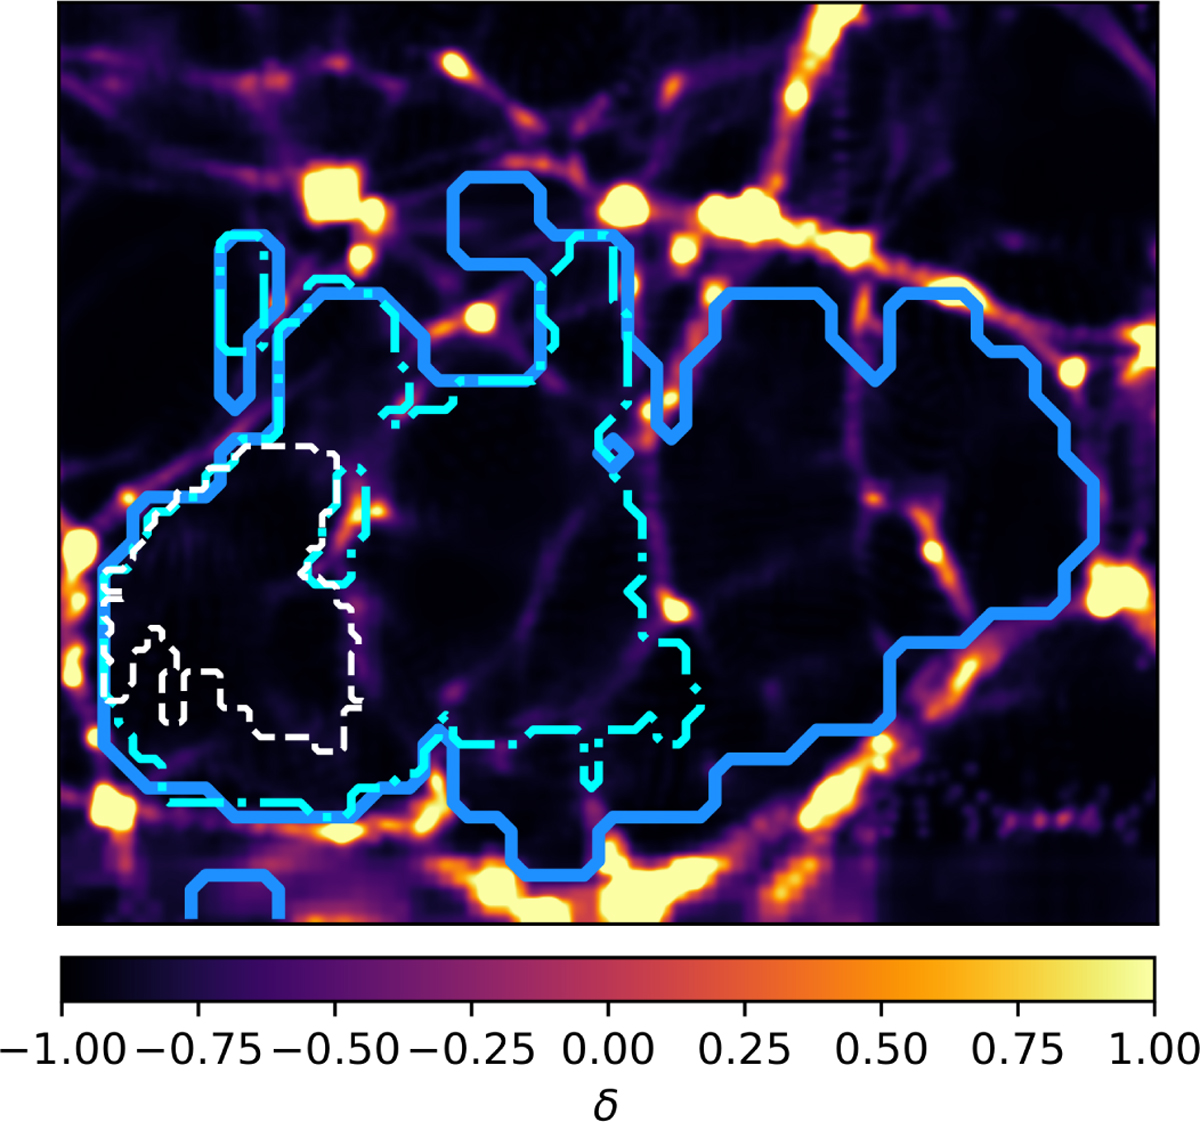
Slice of a zoom-in on a region centred at a Re ≈ 40 Mpc void at ℓ = 0 (solid dark blue line), together with its largest sub-void at ℓ = 1 (dash-dotted light blue line), and a substructure of that sub-void at ℓ = 2 (dashed white line). The slice is 5 Mpc in depth. The colour palette displays the integrated density contrast. The analysis was performed on a snapshot of a MASCLET simulation at z = 0. Additional substructures were obtained for the same void and its sub-voids; however, only one of each level is shown for the sake of clarity.
Current usage metrics show cumulative count of Article Views (full-text article views including HTML views, PDF and ePub downloads, according to the available data) and Abstracts Views on Vision4Press platform.
Data correspond to usage on the plateform after 2015. The current usage metrics is available 48-96 hours after online publication and is updated daily on week days.
Initial download of the metrics may take a while.