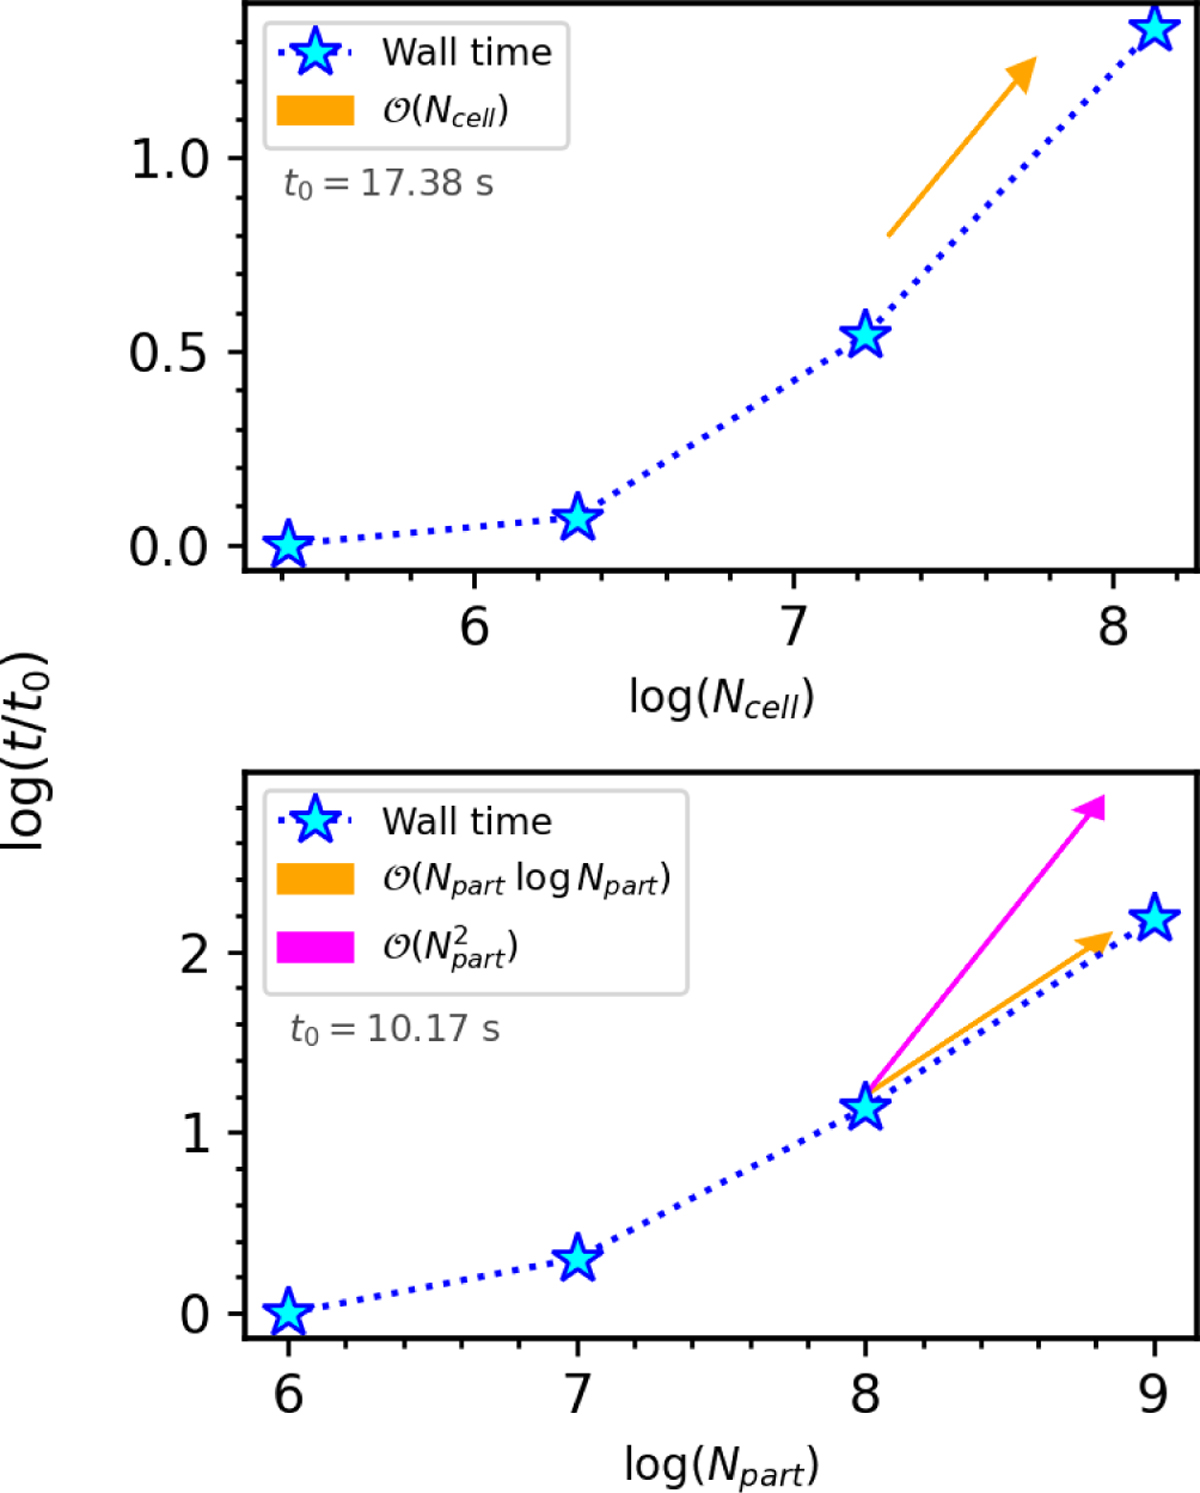
Fig. 6
Download original image
Code time complexity. Times are normalised with respect to t0, the wall time for the minimum number of cells or particles considered in this test, shown below both panel legends. Top panel: wall time against the number of cells. Bottom panel: wall time against the number of particles interpolated onto the grid. In yellow and purple, different time complexities are given as a reference. Logarithms are taken in base 10.
Current usage metrics show cumulative count of Article Views (full-text article views including HTML views, PDF and ePub downloads, according to the available data) and Abstracts Views on Vision4Press platform.
Data correspond to usage on the plateform after 2015. The current usage metrics is available 48-96 hours after online publication and is updated daily on week days.
Initial download of the metrics may take a while.