Fig. 8
Download original image
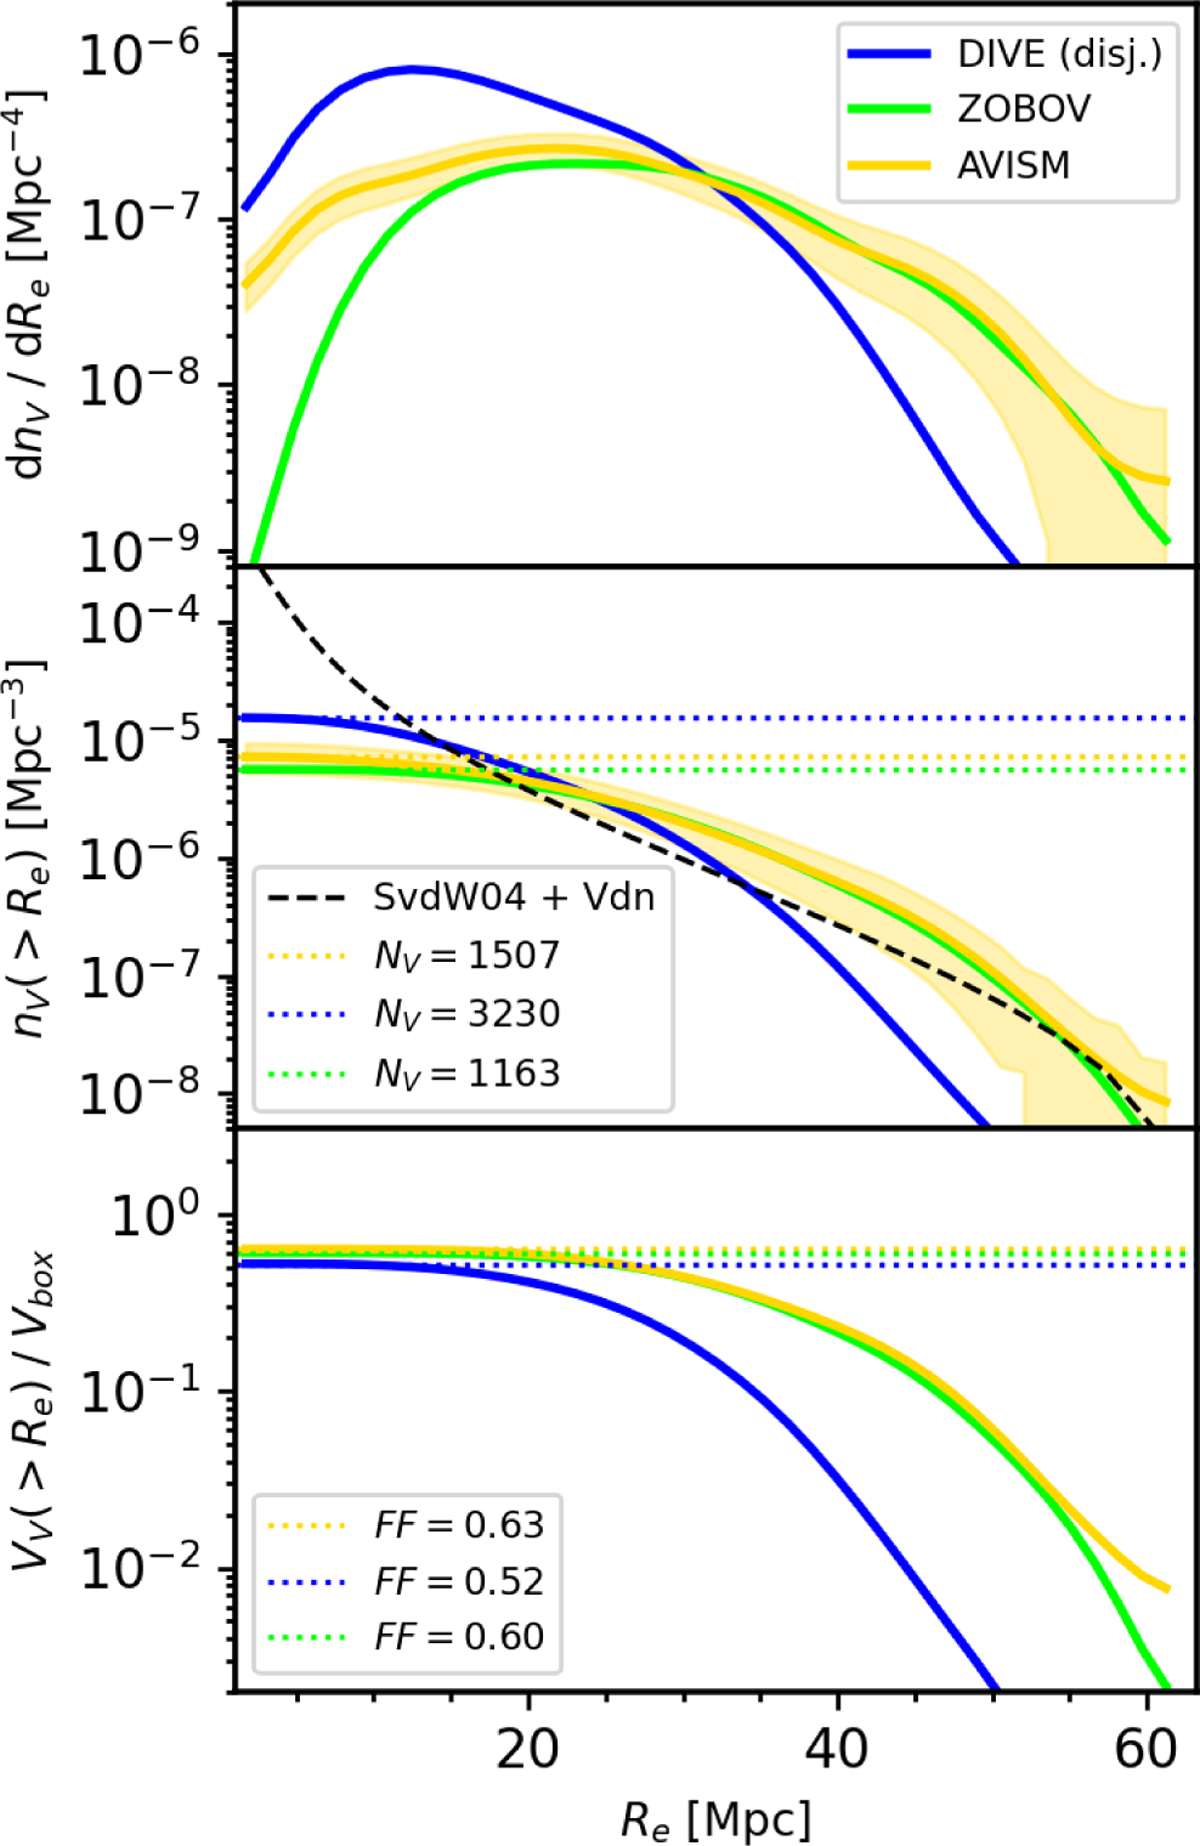
Statistical comparison of the void distribution, as found by DIVE (blue), ZOBOV (green), and AVISM (yellow) using the mini-UCHUU haloes catalogue at z = 0 as input. Top panel: VSF. The gold-shaded region represents 2σ of the Poisson shot noise error. Middle panel: cumulative VSF with horizontal lines depicting the total void number density and the corresponding total void count (NV). The dashed black line represents the best match for the theoretical SvdW+Vdn model (Sheth & Van De Weygaert 2004; Jennings et al. 2013). Bottom panel: volume filling fraction of voids above a given radius. Horizontal lines depict the total filling fraction (FF).
Current usage metrics show cumulative count of Article Views (full-text article views including HTML views, PDF and ePub downloads, according to the available data) and Abstracts Views on Vision4Press platform.
Data correspond to usage on the plateform after 2015. The current usage metrics is available 48-96 hours after online publication and is updated daily on week days.
Initial download of the metrics may take a while.