Fig. 9
Download original image
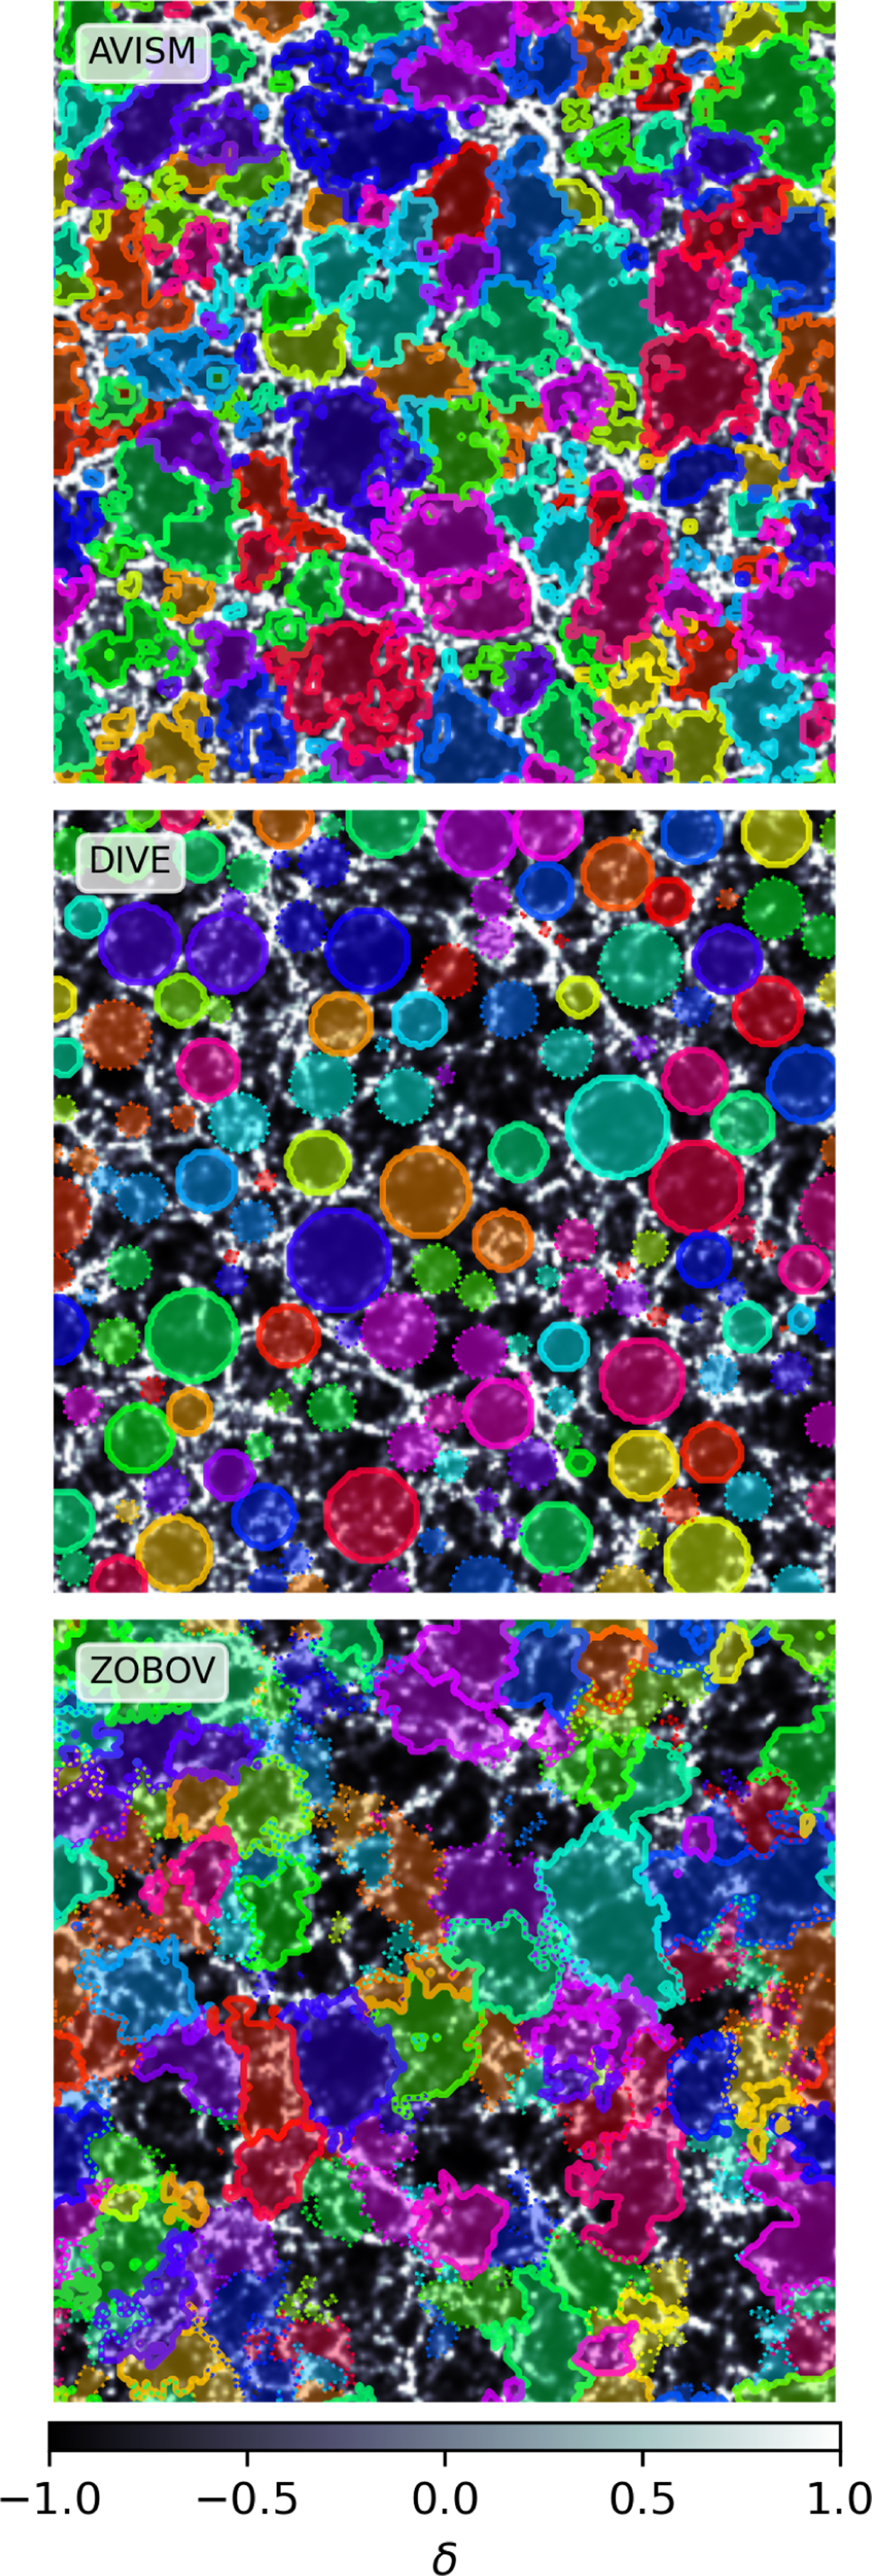
Distribution of voids intersecting a thin slice of 400 Mpc/h side length through the centre of the box. Top, middle, and bottom panels show, respectively, results from AVISM, DIVE, and ZOBOV. Different colours are used to show void zones. Voids matching those from the reference catalogue (AVISM in this case) with a DSC coefficient larger (smaller) than 0.4 are displayed using the same colour and continuous (dotted) lines. Voids are shown overlaid on the integrated contrast density field as interpolated by AVISM, represented in a grey colour scale with values displayed in the colour bar below.
Current usage metrics show cumulative count of Article Views (full-text article views including HTML views, PDF and ePub downloads, according to the available data) and Abstracts Views on Vision4Press platform.
Data correspond to usage on the plateform after 2015. The current usage metrics is available 48-96 hours after online publication and is updated daily on week days.
Initial download of the metrics may take a while.