Fig. 10
Download original image
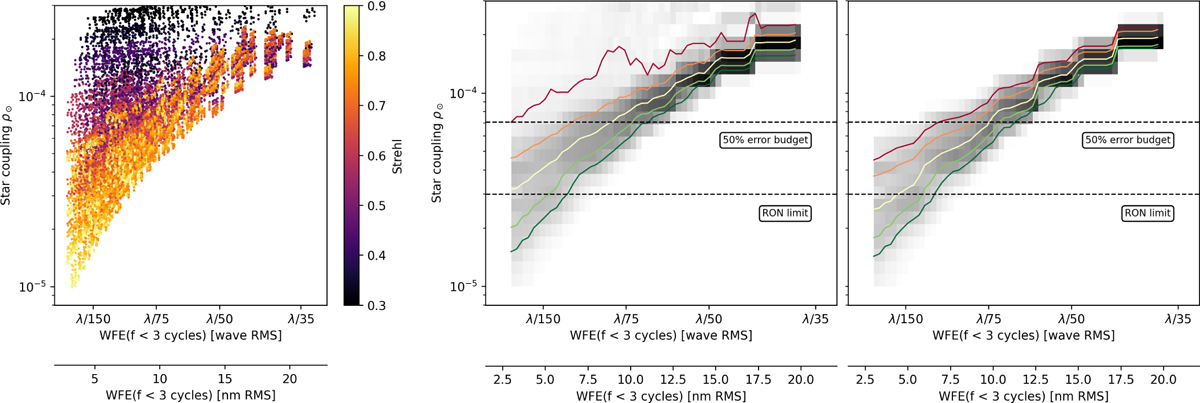
ρ⊙ as a function of the XAO residual error, integrated over three cycles in the pupil diameter. Left: results from different simulations represented by points color coded by Strehl at λ=750 nm. Middle: PSD of all data binned by WFE, shown as a gray map. Green to red curves represent the 10, 25, 50, 75, and 90 percentile of best cases. Right: same as middle, filtered for Strehl≥70%.
Current usage metrics show cumulative count of Article Views (full-text article views including HTML views, PDF and ePub downloads, according to the available data) and Abstracts Views on Vision4Press platform.
Data correspond to usage on the plateform after 2015. The current usage metrics is available 48-96 hours after online publication and is updated daily on week days.
Initial download of the metrics may take a while.