Fig. 14
Download original image
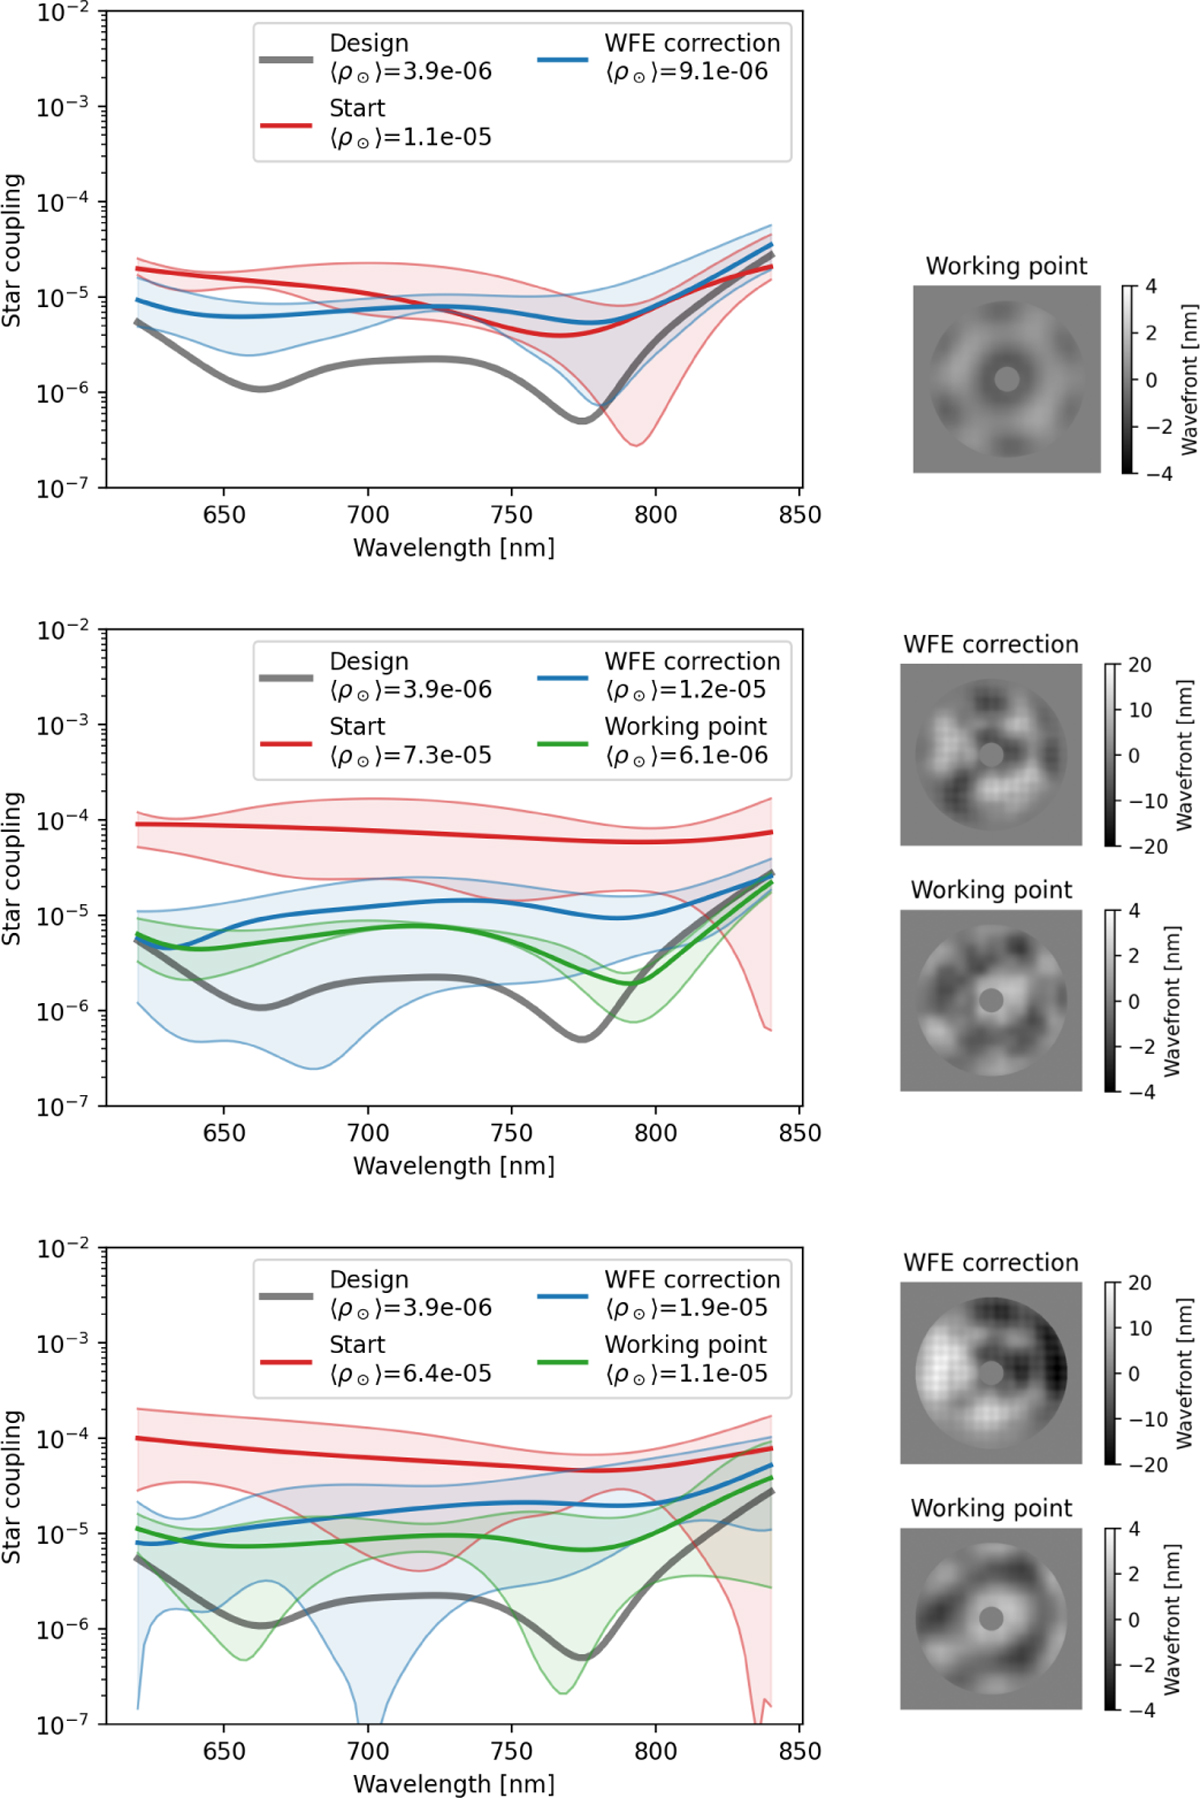
Result of wavefront control with IFU error only (top), PIAA errors only (middle), and the full PIAAN (bottom). Red, blue, and green curves correspond respectively to the start point (DM flat), the result after WFE optimization, and the result after contrast optimization. The filled area corresponds to the envelope covered by the six fibers and the solid line to their average. The resulting DM shaped applied after each step is shown on the right of the plots. M is calibrated at 730 nm.
Current usage metrics show cumulative count of Article Views (full-text article views including HTML views, PDF and ePub downloads, according to the available data) and Abstracts Views on Vision4Press platform.
Data correspond to usage on the plateform after 2015. The current usage metrics is available 48-96 hours after online publication and is updated daily on week days.
Initial download of the metrics may take a while.