Fig. 20
Download original image
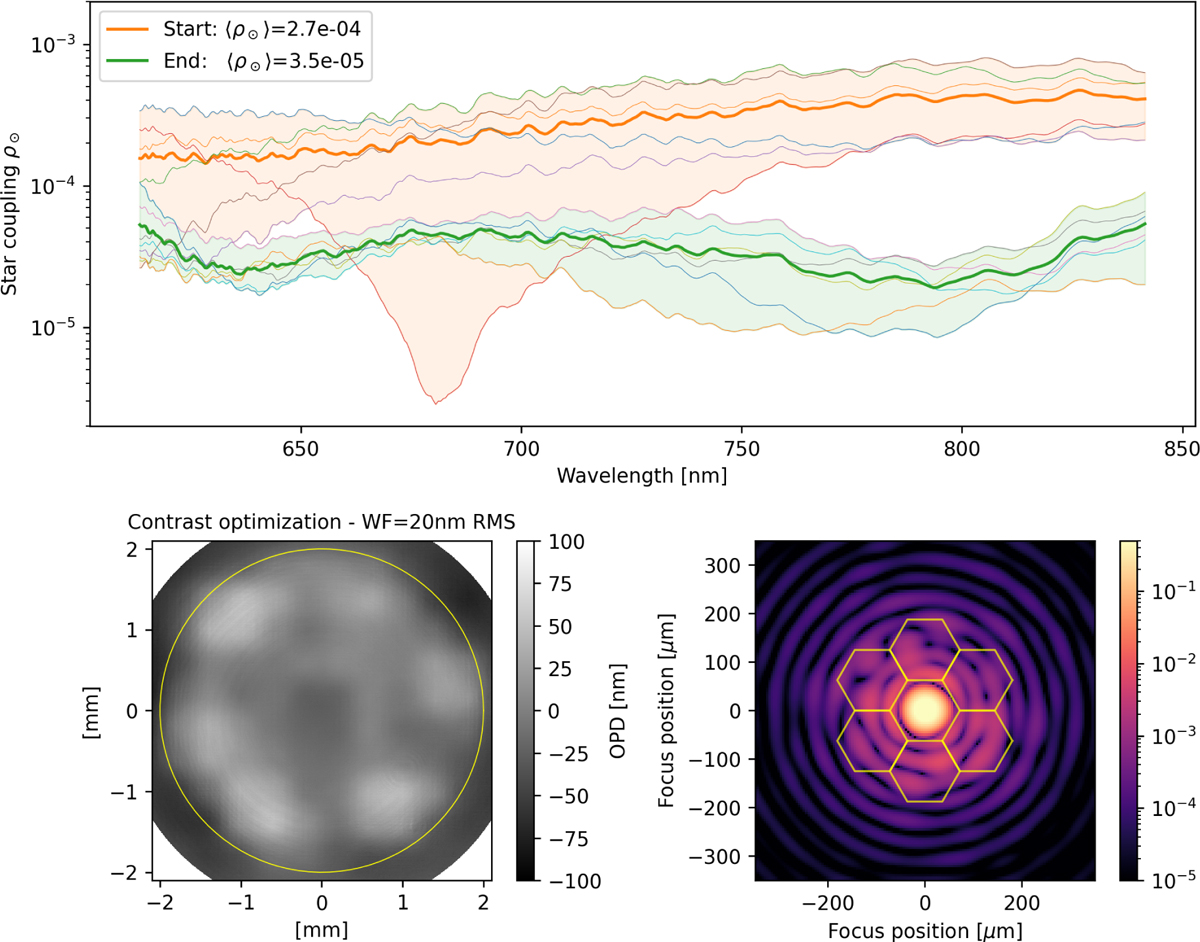
Top: result of the contrast optimization of PIAAN. The starting point is in orange, after Strehl optimization. The filled area shows the envelope covered by the six spaxels, each shown by a colored curve in the envelope. The end result is displayed in green, also with the curve of the six spaxels and the corresponding envelope in green. Bottom left: working point OPD applied on the DM. The yellow circle represents the 4 mm pupil size of the PIAA. Bottom right: resulting PSF at λ=633 nm.
Current usage metrics show cumulative count of Article Views (full-text article views including HTML views, PDF and ePub downloads, according to the available data) and Abstracts Views on Vision4Press platform.
Data correspond to usage on the plateform after 2015. The current usage metrics is available 48-96 hours after online publication and is updated daily on week days.
Initial download of the metrics may take a while.