Open Access
Fig. 21
Download original image
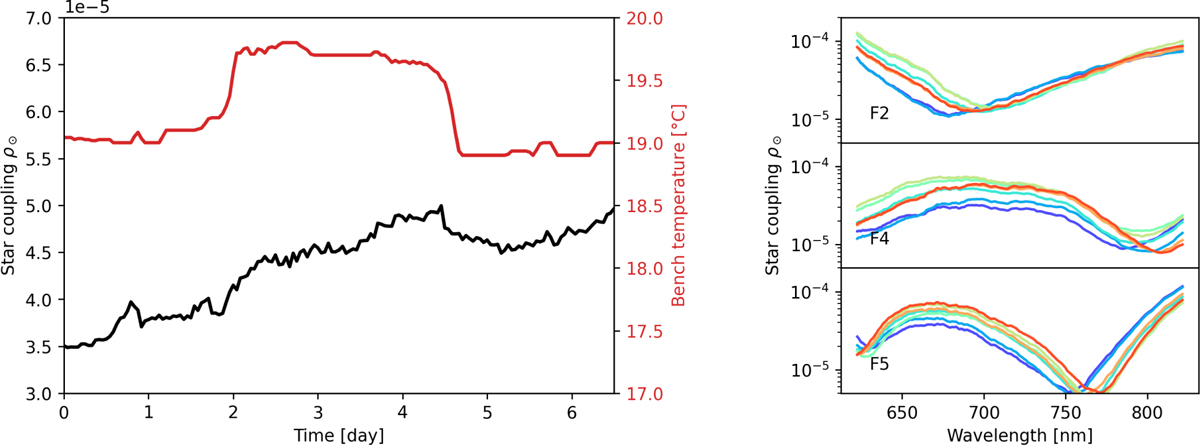
PIAAN stability measurement over a week, with hourly tip-tilt correction. Left: average contrast over the six fibers (black), and bench temperature (red). Right: contrast curves for the three most unstable fibers (#2, #4, and #5). There is a 24h time span between each curve, from blue to red.
Current usage metrics show cumulative count of Article Views (full-text article views including HTML views, PDF and ePub downloads, according to the available data) and Abstracts Views on Vision4Press platform.
Data correspond to usage on the plateform after 2015. The current usage metrics is available 48-96 hours after online publication and is updated daily on week days.
Initial download of the metrics may take a while.