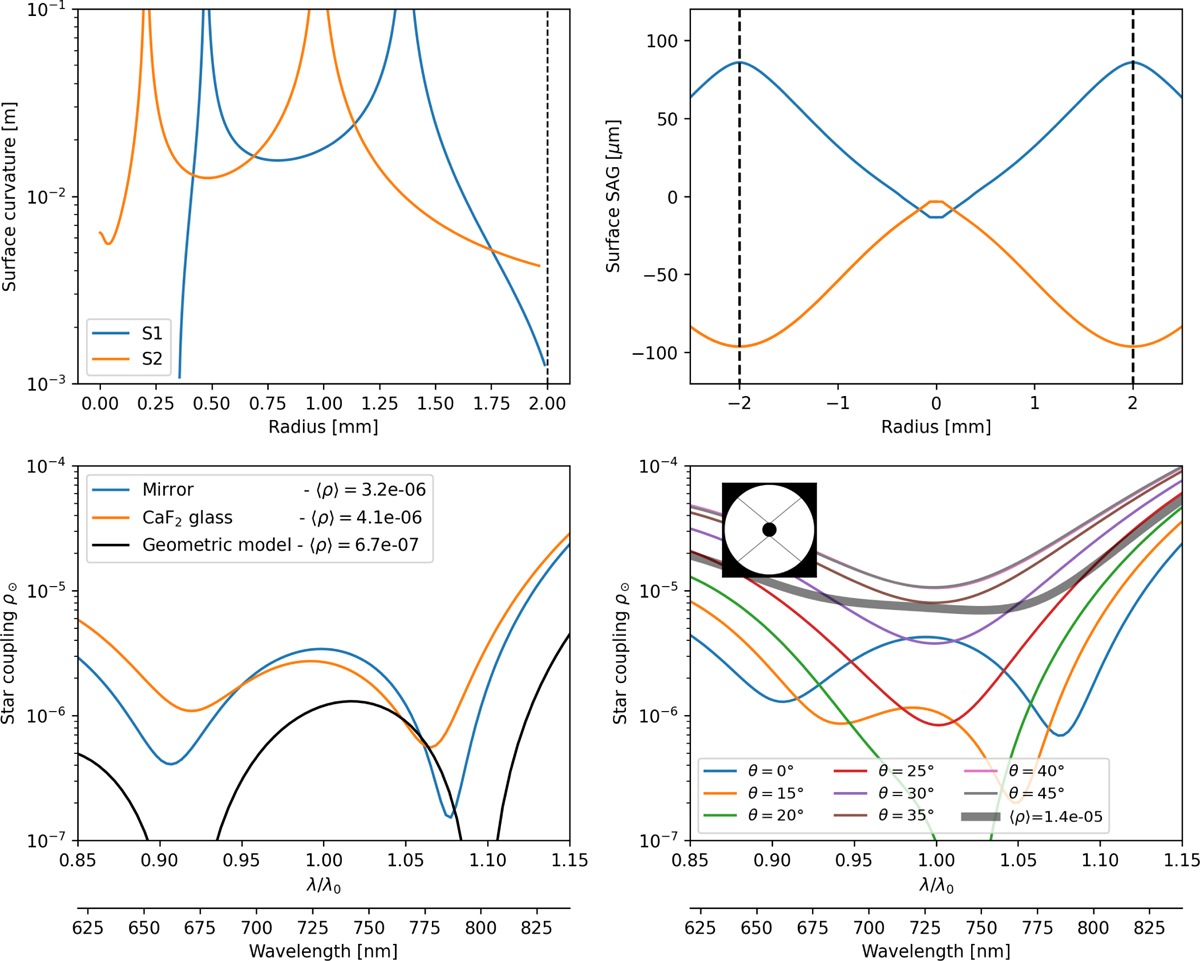
Fig. 7
Download original image
Design and performance of a real PIAAN optics. Top: curvature radius and sag of both aspheres for a CaF2 rod design. Bottom, left: star coupling comparing the geometrical model to physical ones. Bottom, right: star coupling in the presence of VLT spiders. Each color curve represents a different lenslet position angle relative to the displayed pupil on the left corner. θ=0° represents the field position (+37, 0) mas in Fig. 6. Average over all orientations and fibers is shown in gray.
Current usage metrics show cumulative count of Article Views (full-text article views including HTML views, PDF and ePub downloads, according to the available data) and Abstracts Views on Vision4Press platform.
Data correspond to usage on the plateform after 2015. The current usage metrics is available 48-96 hours after online publication and is updated daily on week days.
Initial download of the metrics may take a while.