Fig. 9
Download original image
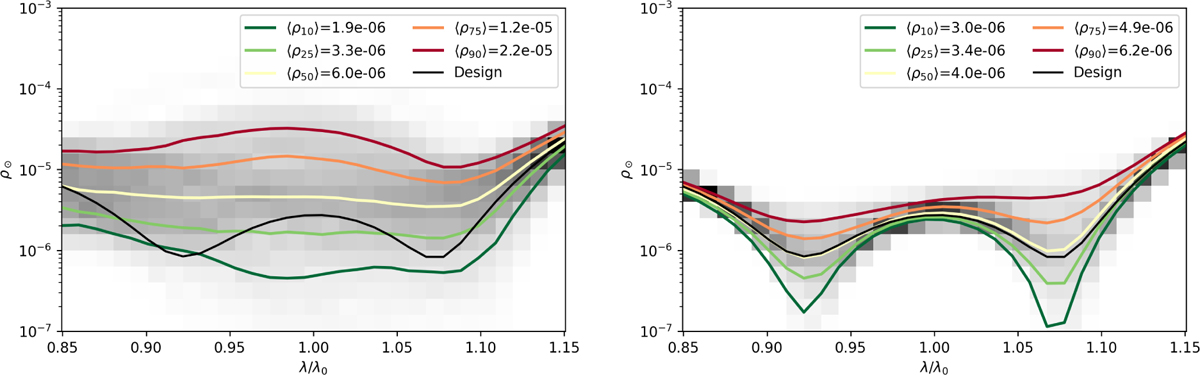
Probability distribution of the PIAAN performance considering manufacturing tolerances. There is no optical aberration in this system, not even on PIAA optics. The gray area is the probability density function for each wavelength. The curves then represent the 10, 25, 50, 75, and 90 percentile of the realizations for each wavelength. They do not represent a likelihood to obtain an actual contrast curve. Left: all tolerances included as presented in Table 2. Right: result when a perfect IFU is considered.
Current usage metrics show cumulative count of Article Views (full-text article views including HTML views, PDF and ePub downloads, according to the available data) and Abstracts Views on Vision4Press platform.
Data correspond to usage on the plateform after 2015. The current usage metrics is available 48-96 hours after online publication and is updated daily on week days.
Initial download of the metrics may take a while.