Fig. 13
Download original image
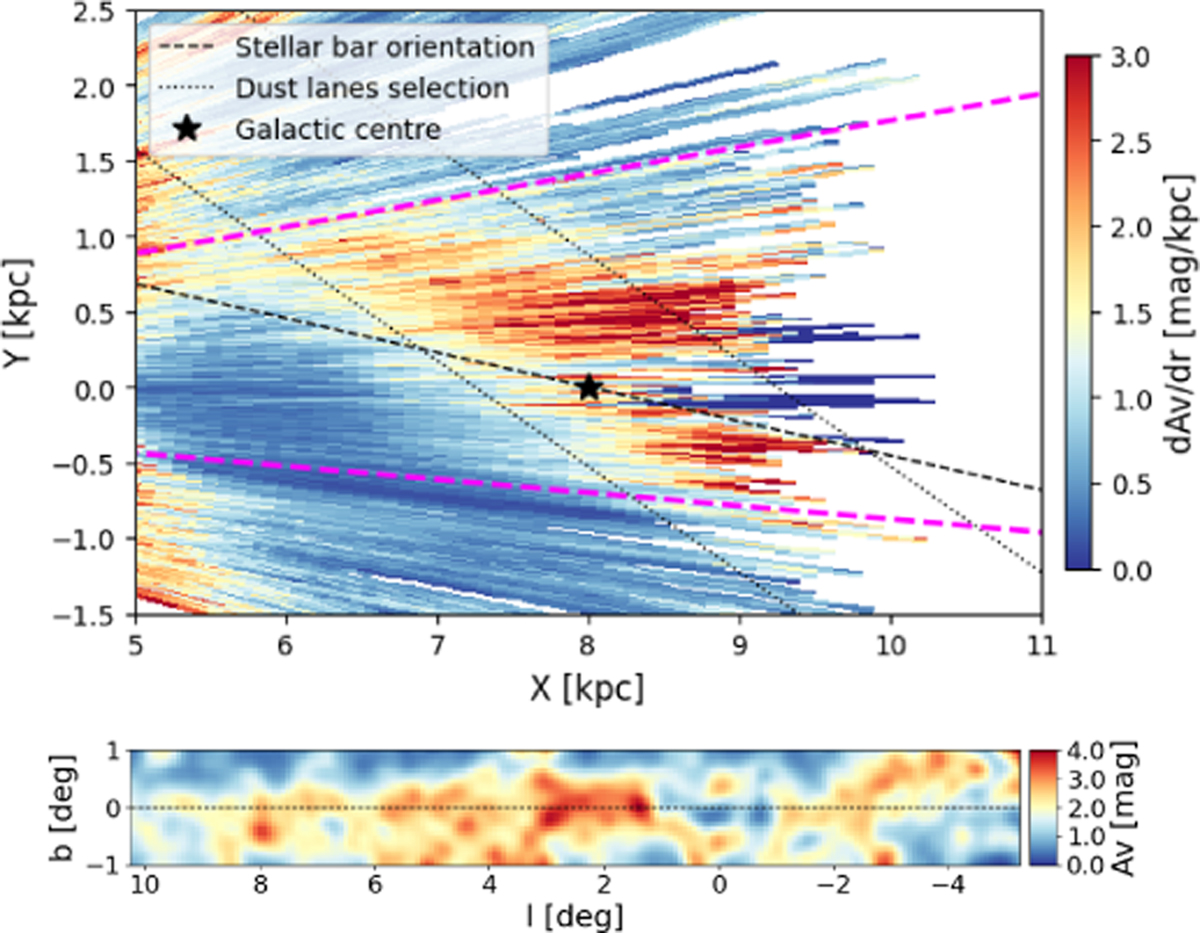
Top: top-down view of the Galactic centre region. The Galactic centre is marked with a star, and the stellar bar, as modelled by the BGM, is indicated by the dashed line. The dotted lines delimit the region selected for the study of the dust lanes. Bottom: sky projection of the dust distribution within the region defined by the dotted lines in the top panel. The longitude range used is indicated by the magenta dashed line in the top panel. The dust lanes exhibit a clear tilt: at negative longitudes, the dust lies above the Galactic plane (b = 0°), while at positive longitudes, it lies below.
Current usage metrics show cumulative count of Article Views (full-text article views including HTML views, PDF and ePub downloads, according to the available data) and Abstracts Views on Vision4Press platform.
Data correspond to usage on the plateform after 2015. The current usage metrics is available 48-96 hours after online publication and is updated daily on week days.
Initial download of the metrics may take a while.