Fig. B.1
Download original image
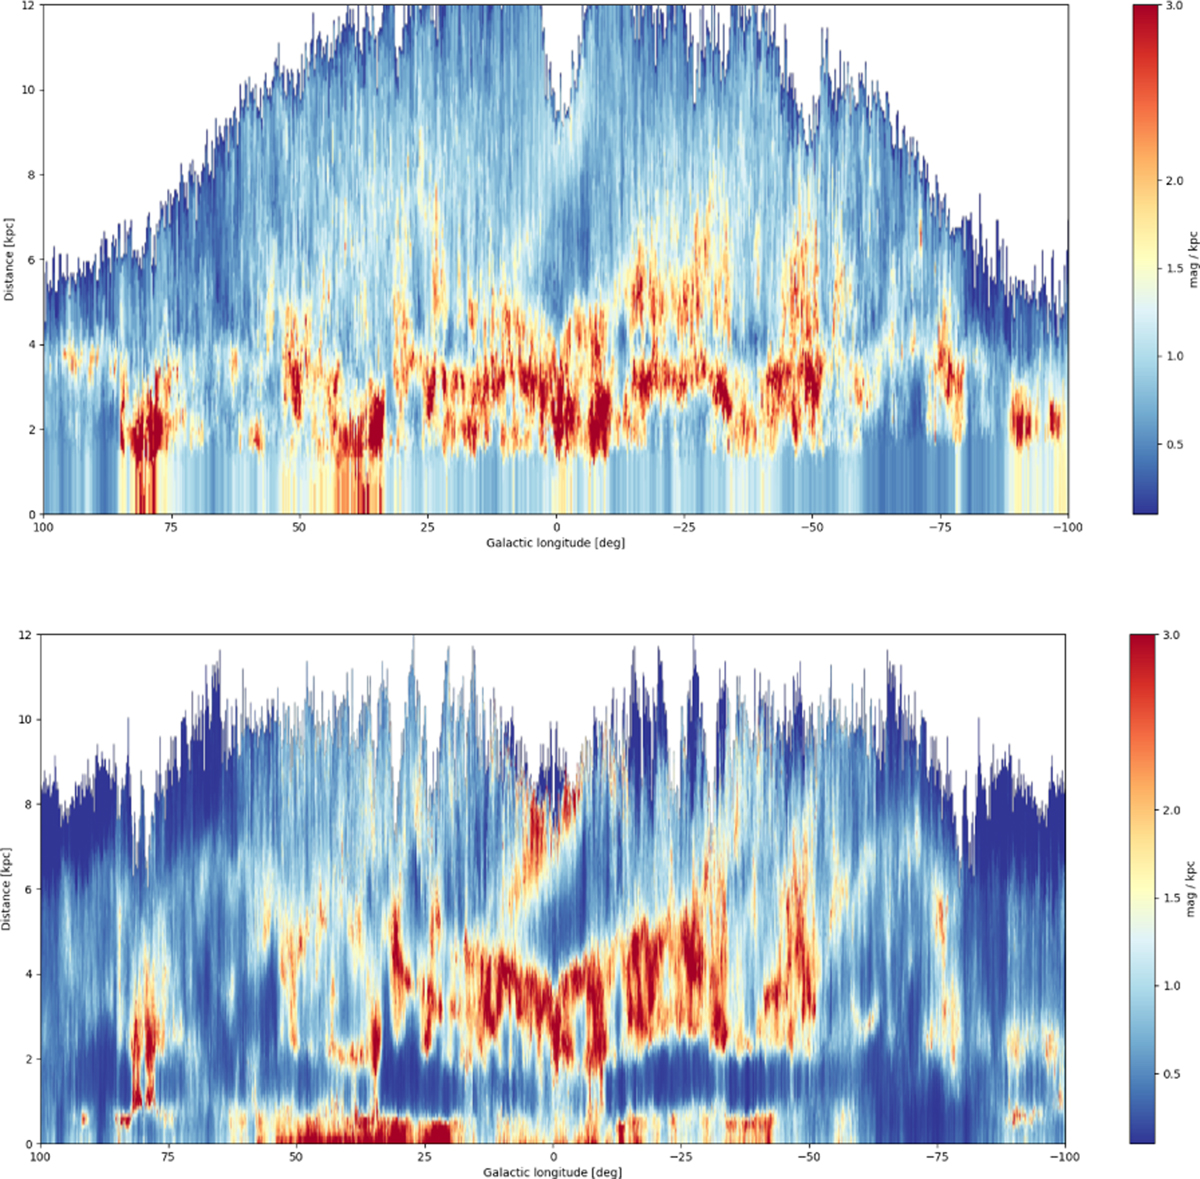
Comparison between the results of (Marshall et al. 2006) (top) with those of REDLINE (bottom). Both maps are on the same colour scale. The maps are the result of choosing lines of sight in the region |l| <= 100° and |b| <= 1° (corresponding to the overlap of the two maps). The dense structures in the REDLINE maps are more defined than those in M06, and cover a larger distance range.
Current usage metrics show cumulative count of Article Views (full-text article views including HTML views, PDF and ePub downloads, according to the available data) and Abstracts Views on Vision4Press platform.
Data correspond to usage on the plateform after 2015. The current usage metrics is available 48-96 hours after online publication and is updated daily on week days.
Initial download of the metrics may take a while.