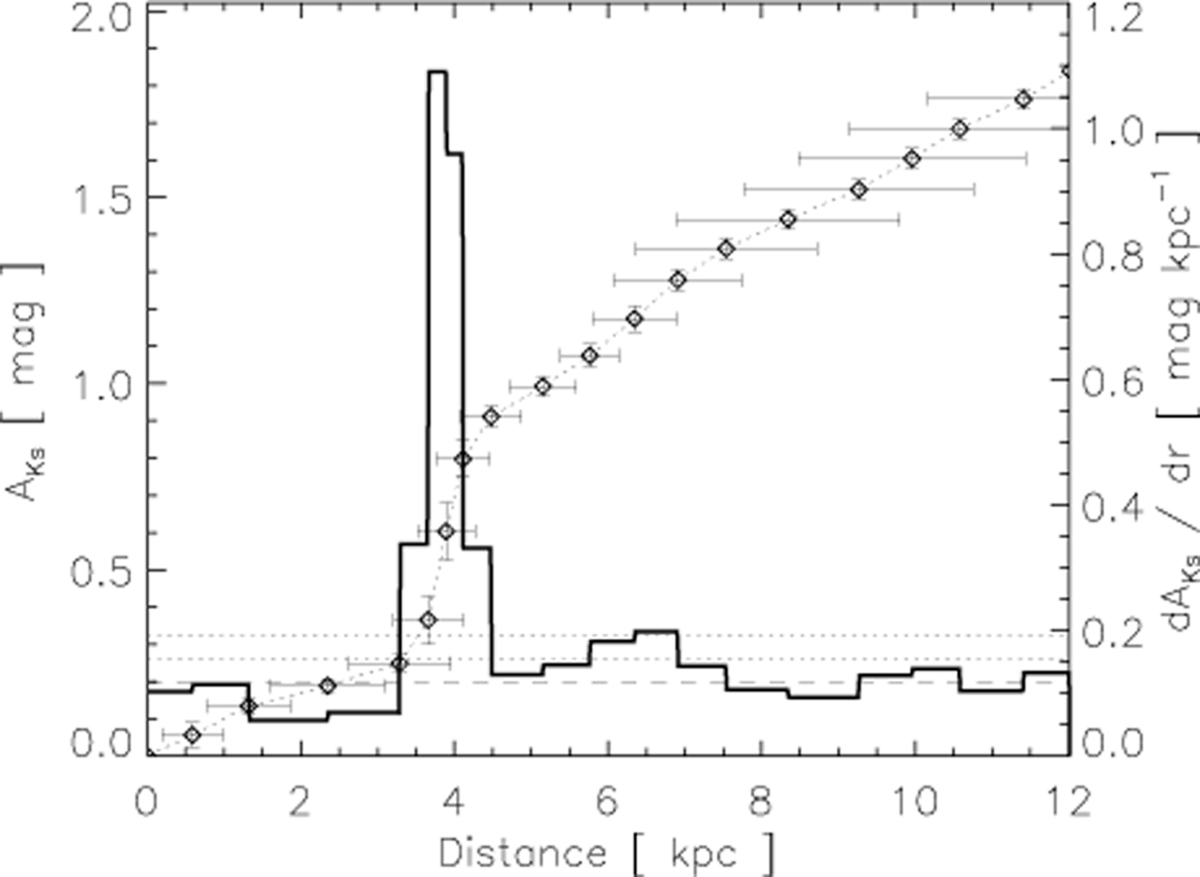
Fig. 2
Download original image
Result of REDLINE in the presence of a single cloud using simulated observations. The diamonds with error bars are the different distance-extinction pairs (left axis), the solid line is the derivative of the extinction with respect to distance, the dashed line is the diffuse extinction, and the dotted lines show the 1 and 2-σ levels (right axis). Here a cloud is clearly detected at 4 kpc, identical to the injected cloud distance.
Current usage metrics show cumulative count of Article Views (full-text article views including HTML views, PDF and ePub downloads, according to the available data) and Abstracts Views on Vision4Press platform.
Data correspond to usage on the plateform after 2015. The current usage metrics is available 48-96 hours after online publication and is updated daily on week days.
Initial download of the metrics may take a while.