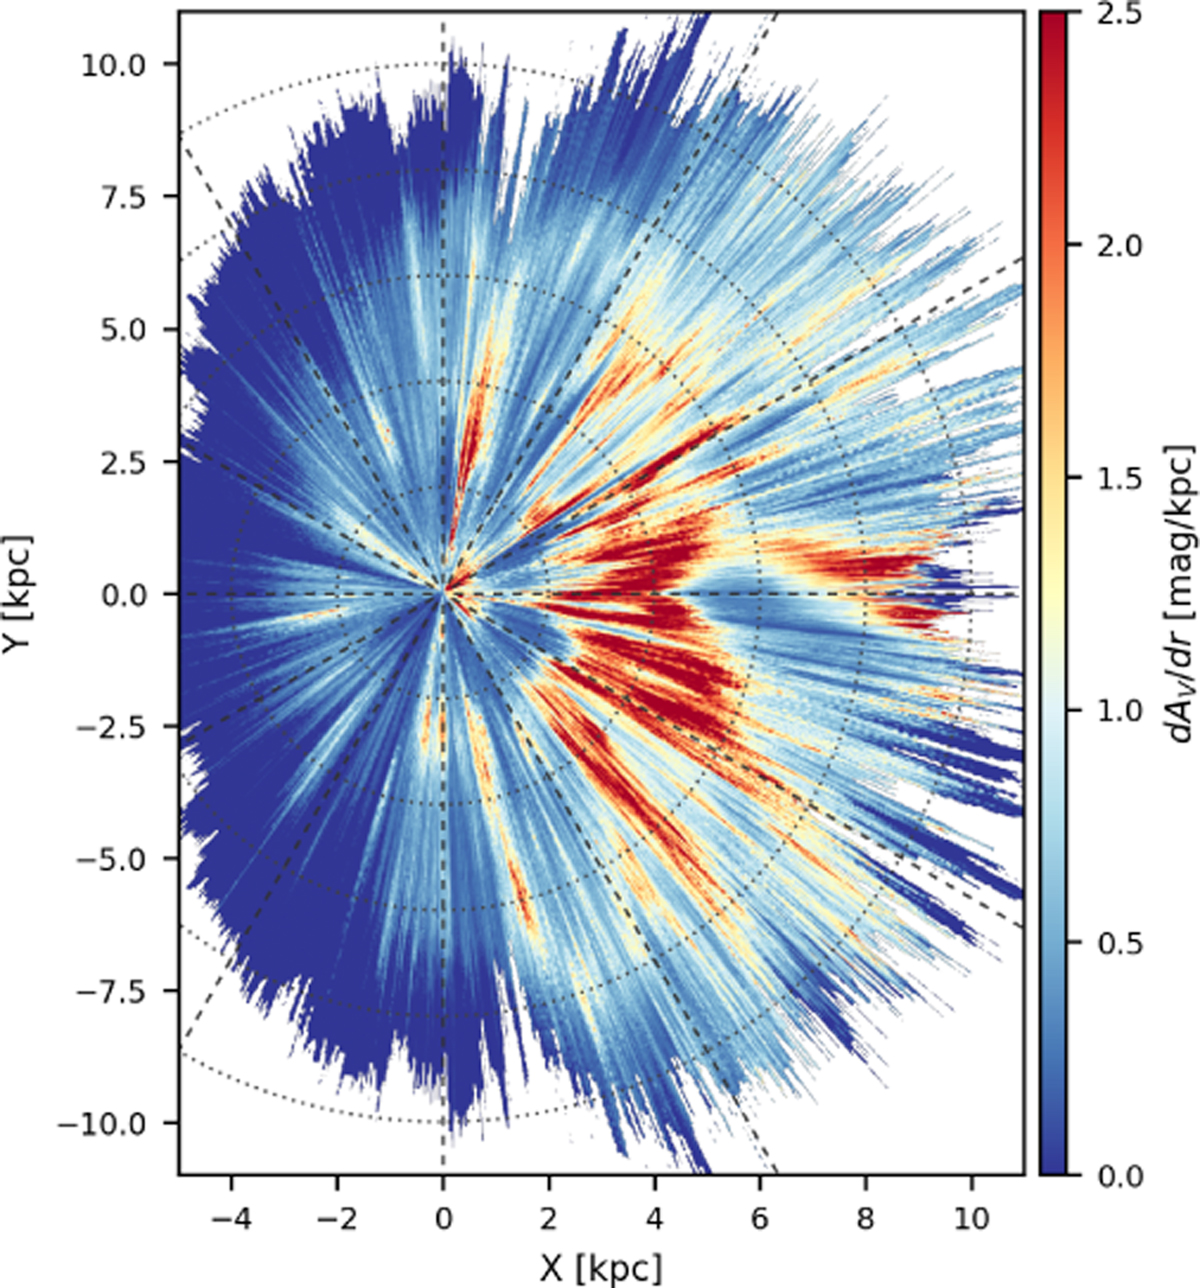
Fig. 4
Download original image
REDLINE view of the Galactic plane as seen from the North Galactic Pole. The Sun is at the origin and the Galactic centre is at (x, y) = (8, 0). Dotted circles are plotted every 2 kpc around the solar position, and dashed lines are plotted every 30 degrees. The quantity plotted here is extinction per unit distance, and is proportional to dust density. There is a paucity of dust in the outer Galaxy, and most of the dust is seen to lie in the so-called molecular ring.
Current usage metrics show cumulative count of Article Views (full-text article views including HTML views, PDF and ePub downloads, according to the available data) and Abstracts Views on Vision4Press platform.
Data correspond to usage on the plateform after 2015. The current usage metrics is available 48-96 hours after online publication and is updated daily on week days.
Initial download of the metrics may take a while.