Fig. D.1
Download original image
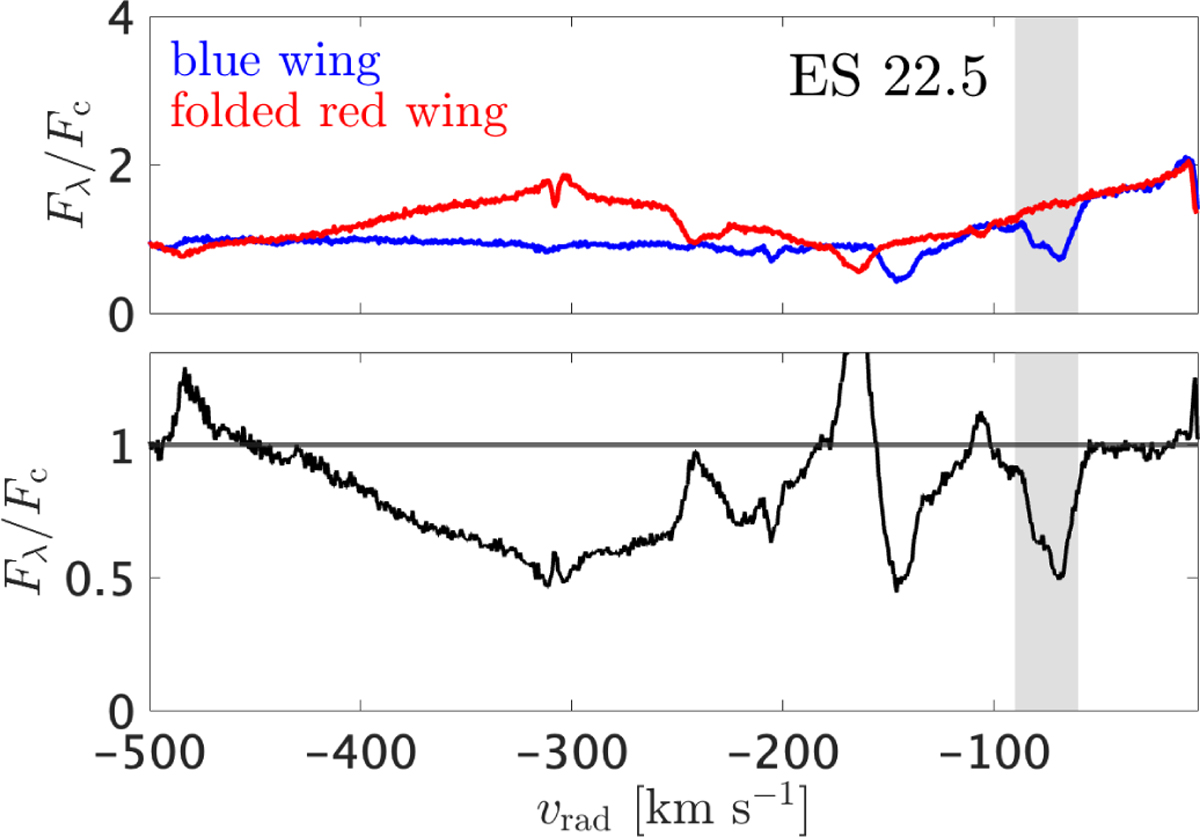
Extraction of the LVA component of the Na I D2 line in the ES 22.5 spectrum. The top panel shows the red wing line folded onto the blue wing. The bottom panel shows the ratio between the blue wing and the red wing, from which we computed the optical depth and EW. The shaded area marks the velocity extension of the LVA, as defined in Fig. 3.
Current usage metrics show cumulative count of Article Views (full-text article views including HTML views, PDF and ePub downloads, according to the available data) and Abstracts Views on Vision4Press platform.
Data correspond to usage on the plateform after 2015. The current usage metrics is available 48-96 hours after online publication and is updated daily on week days.
Initial download of the metrics may take a while.