Fig. F.1
Download original image
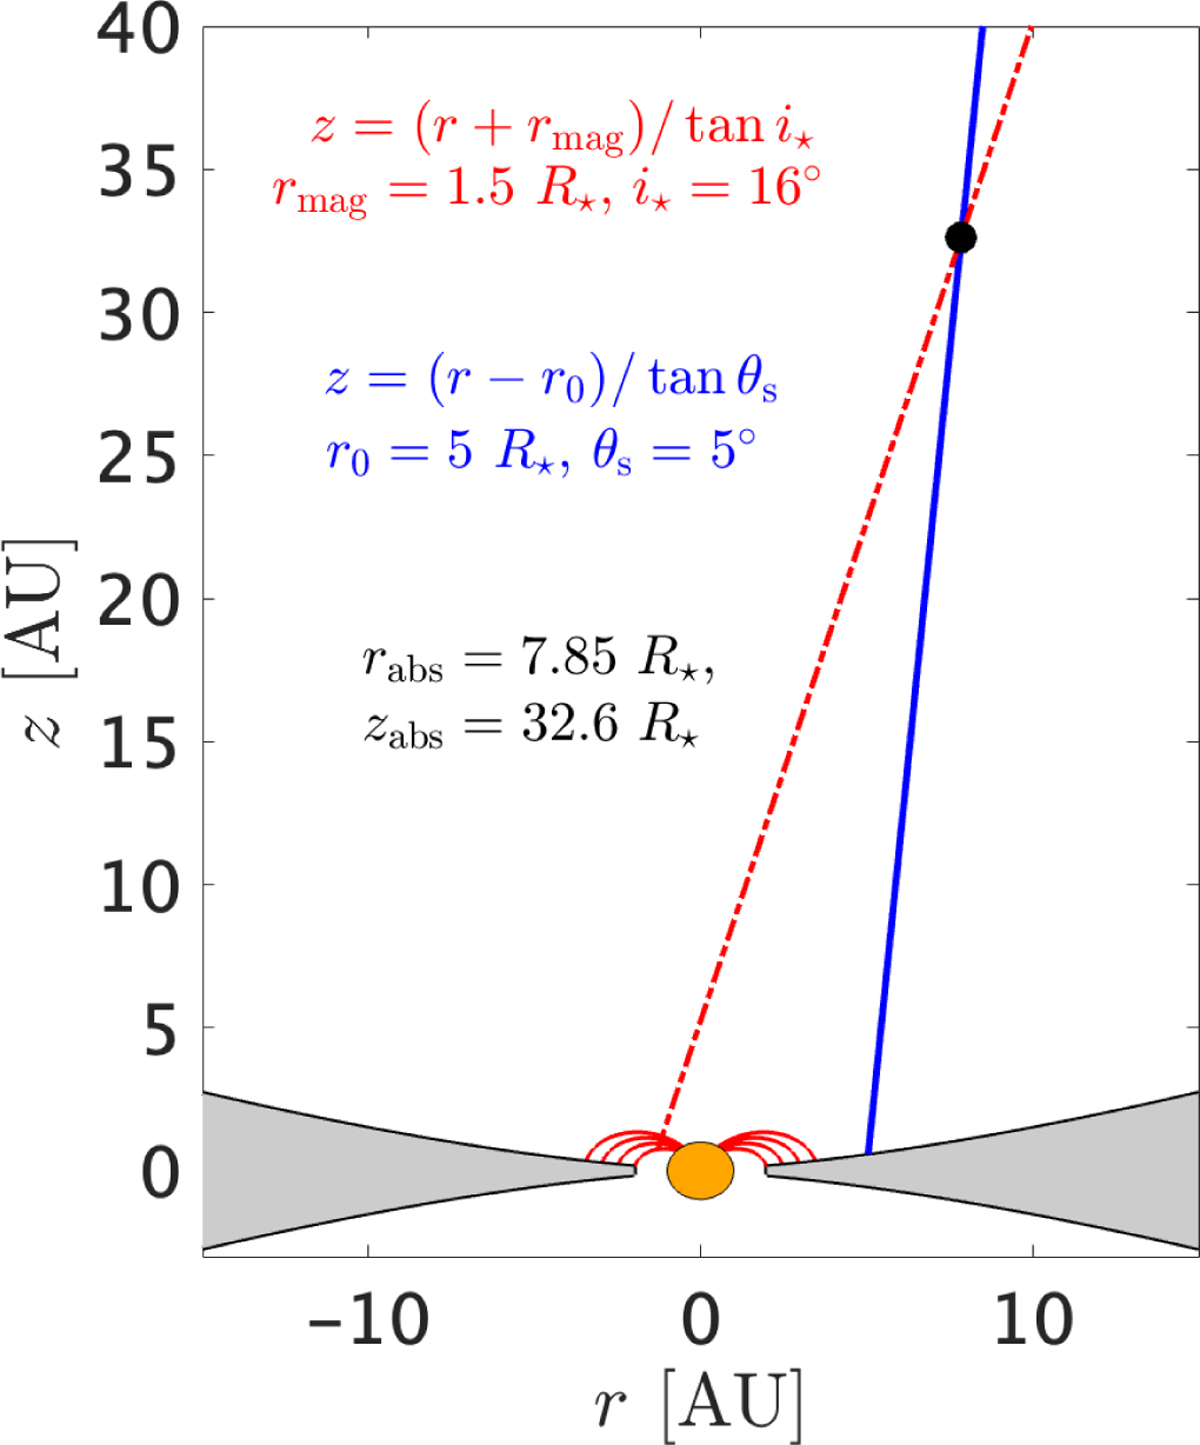
Example of the geometrical model used to estimate the absorbing radius of the discrete absorption components. The red dashed line represents the line of sight to the magnetosphere. The blue line shows a streamline launched from the disk. The black dot marks the intersection point between the two lines, which defines the location of the absorbing gas.
Current usage metrics show cumulative count of Article Views (full-text article views including HTML views, PDF and ePub downloads, according to the available data) and Abstracts Views on Vision4Press platform.
Data correspond to usage on the plateform after 2015. The current usage metrics is available 48-96 hours after online publication and is updated daily on week days.
Initial download of the metrics may take a while.