Fig. F.2
Download original image
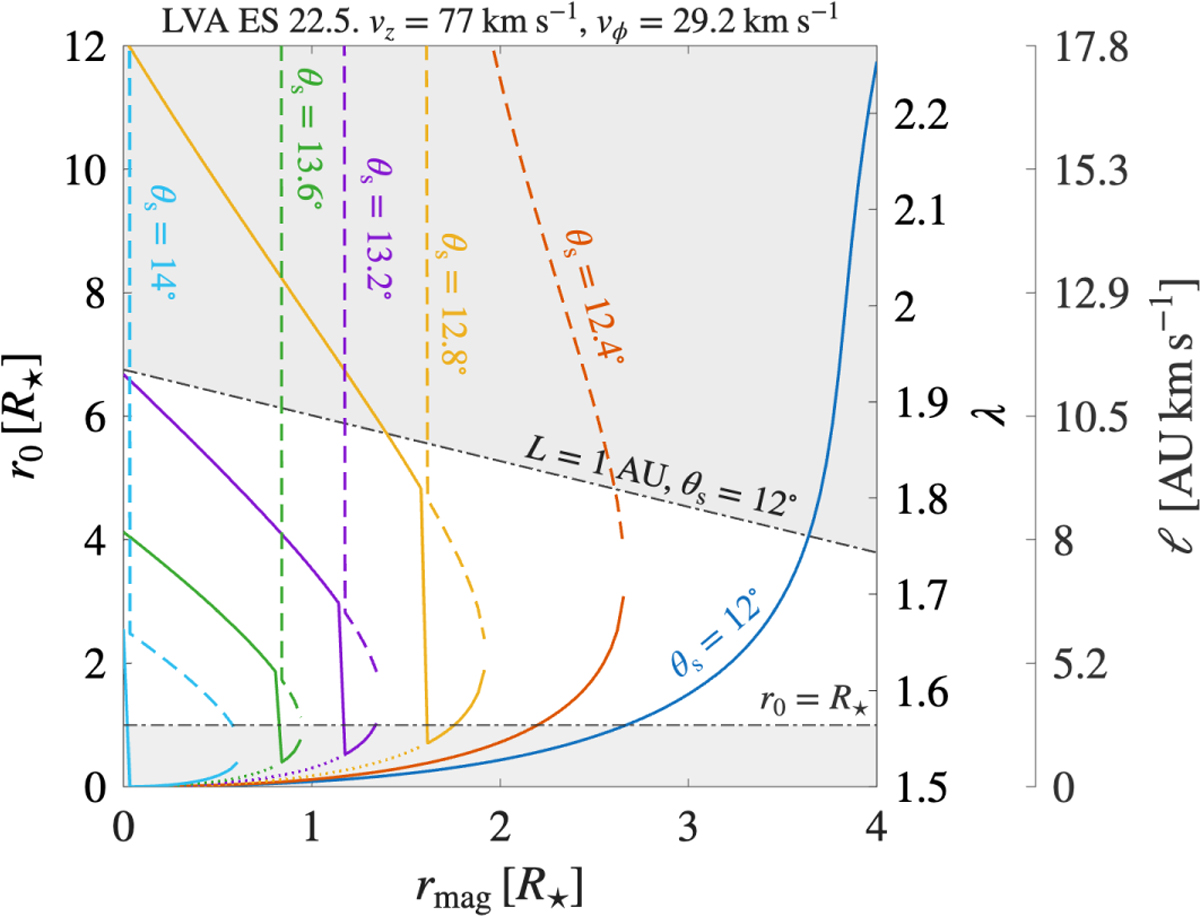
r0 vs. rmag plot for the LVA in ES 22.5. Colors denote different θs. Solid, dashed, and dotted curves indicate distinct solution branches of Eq. (6). The black dash–dotted lines mark the lower (stellar radius R⋆) and upper (given by the maximum distance at which absorption can form) limits on r0. The shaded areas indicate the excluded regions. The axes on the right show the corresponding magnetic lever arm λ and specific angular momentum ℓ, computed using vz, r0 and Eqs. (3) and (4).
Current usage metrics show cumulative count of Article Views (full-text article views including HTML views, PDF and ePub downloads, according to the available data) and Abstracts Views on Vision4Press platform.
Data correspond to usage on the plateform after 2015. The current usage metrics is available 48-96 hours after online publication and is updated daily on week days.
Initial download of the metrics may take a while.