Open Access
Fig. 2
Download original image
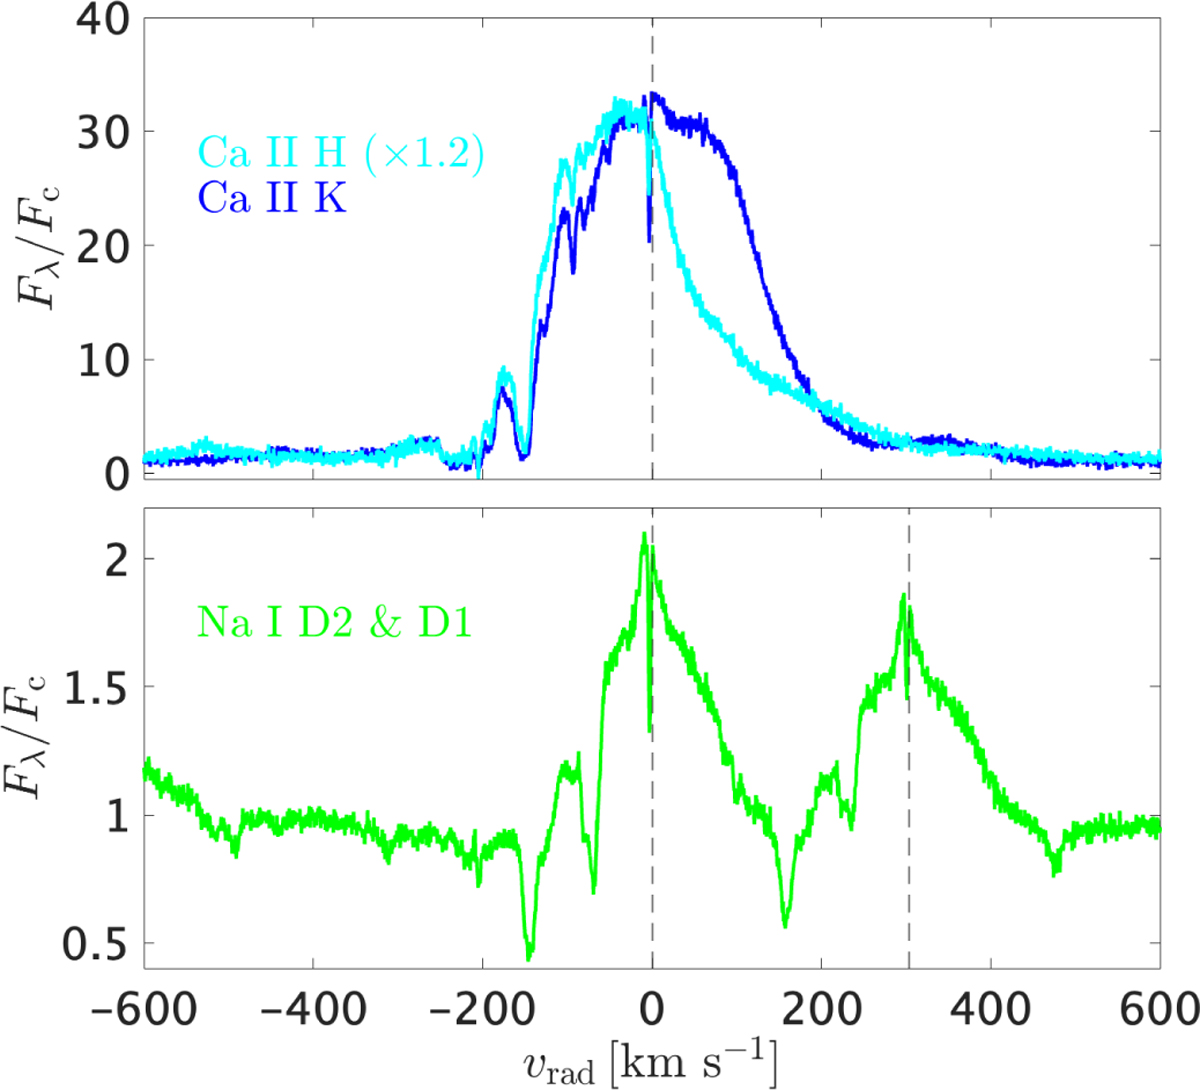
Profiles of the Ca II H & K and Na I D2 & D1 doublets in the ES 22.5 spectrum of RU Lup. The Ca II H & K lines are plotted in velocity relative to their rest wavelengths. The Na I doublet is plotted in velocity relative to the rest wavelength of the D2 line.
Current usage metrics show cumulative count of Article Views (full-text article views including HTML views, PDF and ePub downloads, according to the available data) and Abstracts Views on Vision4Press platform.
Data correspond to usage on the plateform after 2015. The current usage metrics is available 48-96 hours after online publication and is updated daily on week days.
Initial download of the metrics may take a while.