Open Access
Fig. 4
Download original image
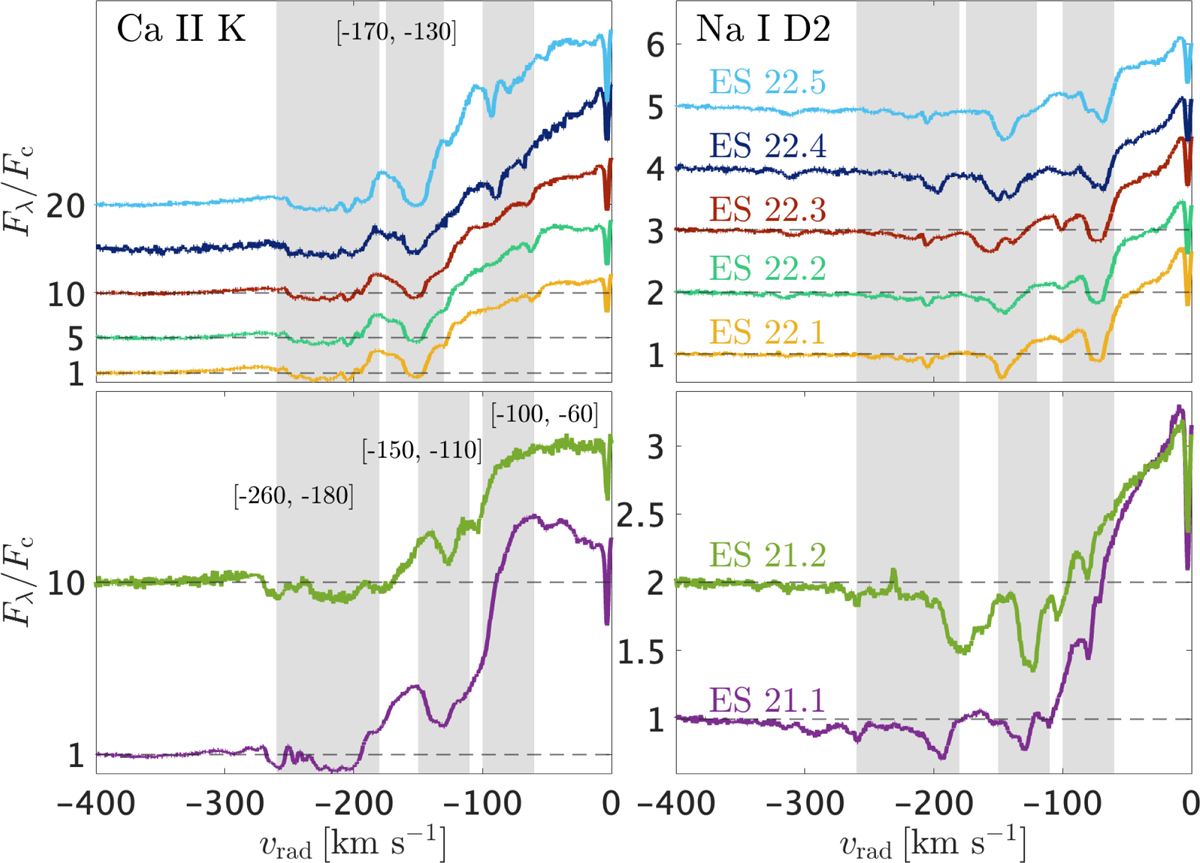
Variability of the Ca II K and Na I D2 lines in the high resolution ESPRESSO spectra (Table A.1). The shaded areas mark the velocity ranges where absorption is observed. These ranges are the same as in Fig. 3 for the spectra from 2022, while the velocity range of the MVA is different in 2021, being [−150, −110] km s−1.
Current usage metrics show cumulative count of Article Views (full-text article views including HTML views, PDF and ePub downloads, according to the available data) and Abstracts Views on Vision4Press platform.
Data correspond to usage on the plateform after 2015. The current usage metrics is available 48-96 hours after online publication and is updated daily on week days.
Initial download of the metrics may take a while.