Fig. 5
Download original image
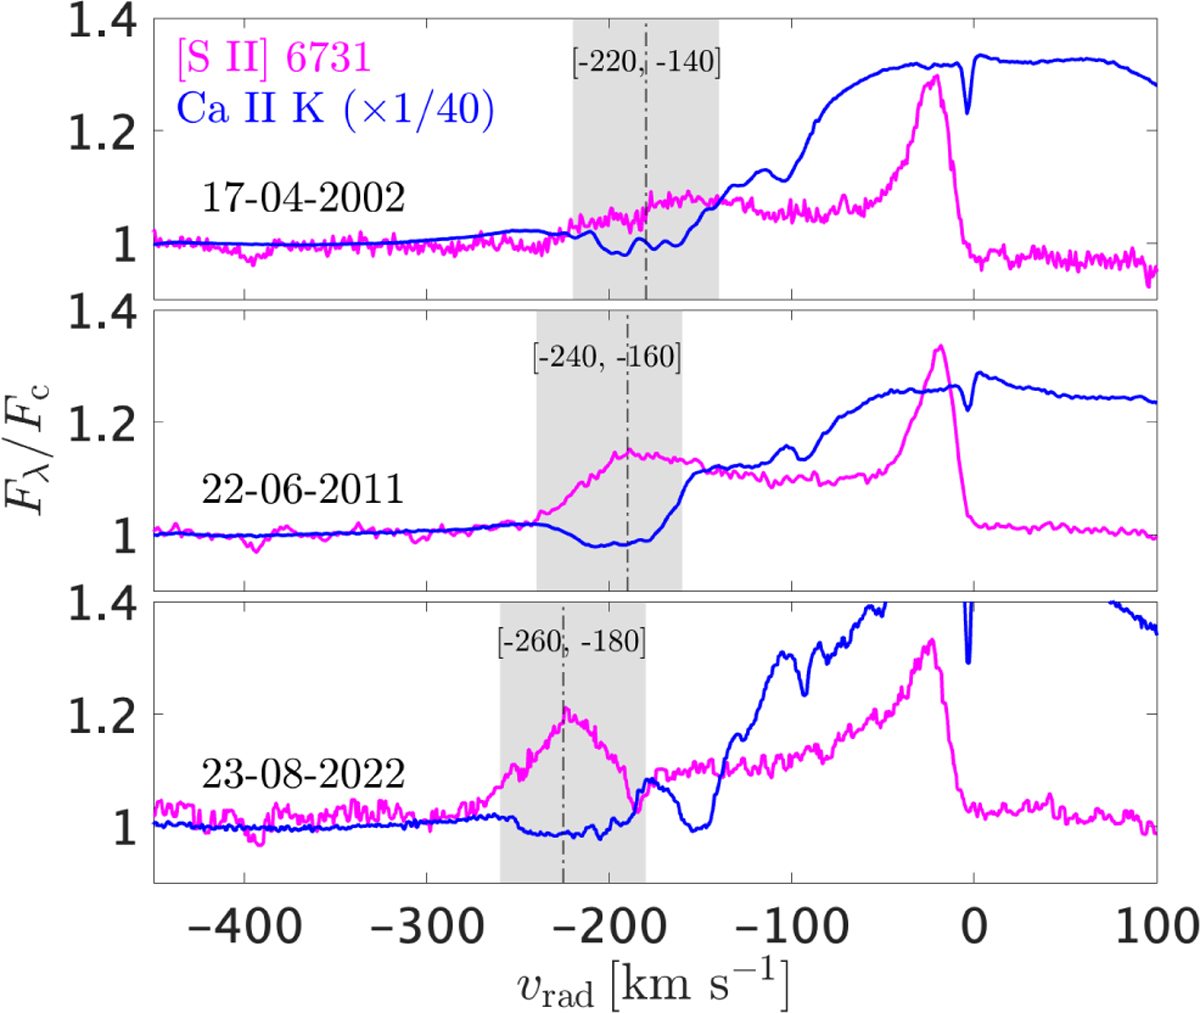
Comparison of the Ca II K (blue) and [S II] 6731 (magenta) lines for a selection of RU Lup spectra. From top to bottom, the spectra are from UVES, ESPaDOnS, and ESPRESSO. The Ca II K lines were scaled by a factor of 1/40. The shaded areas trace the evolution of the two components, while the vertical lines mark the peak vrad of the HVC.
Current usage metrics show cumulative count of Article Views (full-text article views including HTML views, PDF and ePub downloads, according to the available data) and Abstracts Views on Vision4Press platform.
Data correspond to usage on the plateform after 2015. The current usage metrics is available 48-96 hours after online publication and is updated daily on week days.
Initial download of the metrics may take a while.