Fig. A.1
Download original image
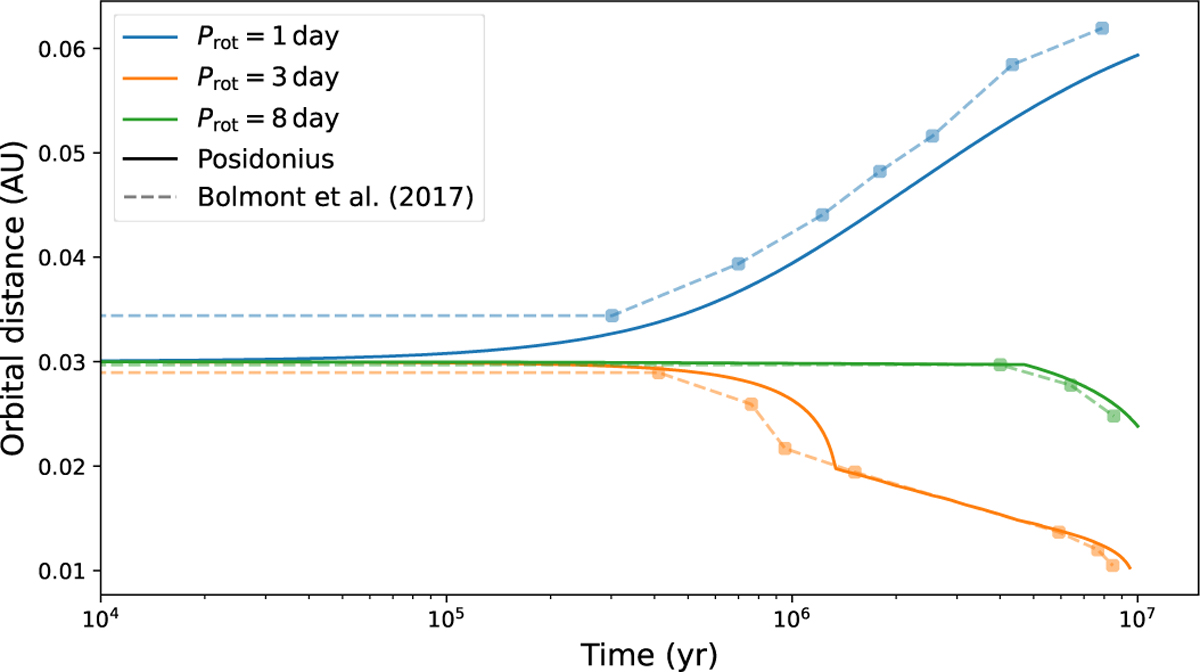
Comparison between the output of POSIDONIUS and Figure 6 in Bolmont et al. (2017) for the evolution of the semimajor axis of a Jupiter-mass planet, due to the dynamical tide and for different initial stellar rotation periods (1, 3, and 8 days). The dashed curves on this plot correspond to the cyan curves in Figure 6 in Bolmont et al. (2017), which were computed for a solar metallicity (Z = 0.0134).
Current usage metrics show cumulative count of Article Views (full-text article views including HTML views, PDF and ePub downloads, according to the available data) and Abstracts Views on Vision4Press platform.
Data correspond to usage on the plateform after 2015. The current usage metrics is available 48-96 hours after online publication and is updated daily on week days.
Initial download of the metrics may take a while.