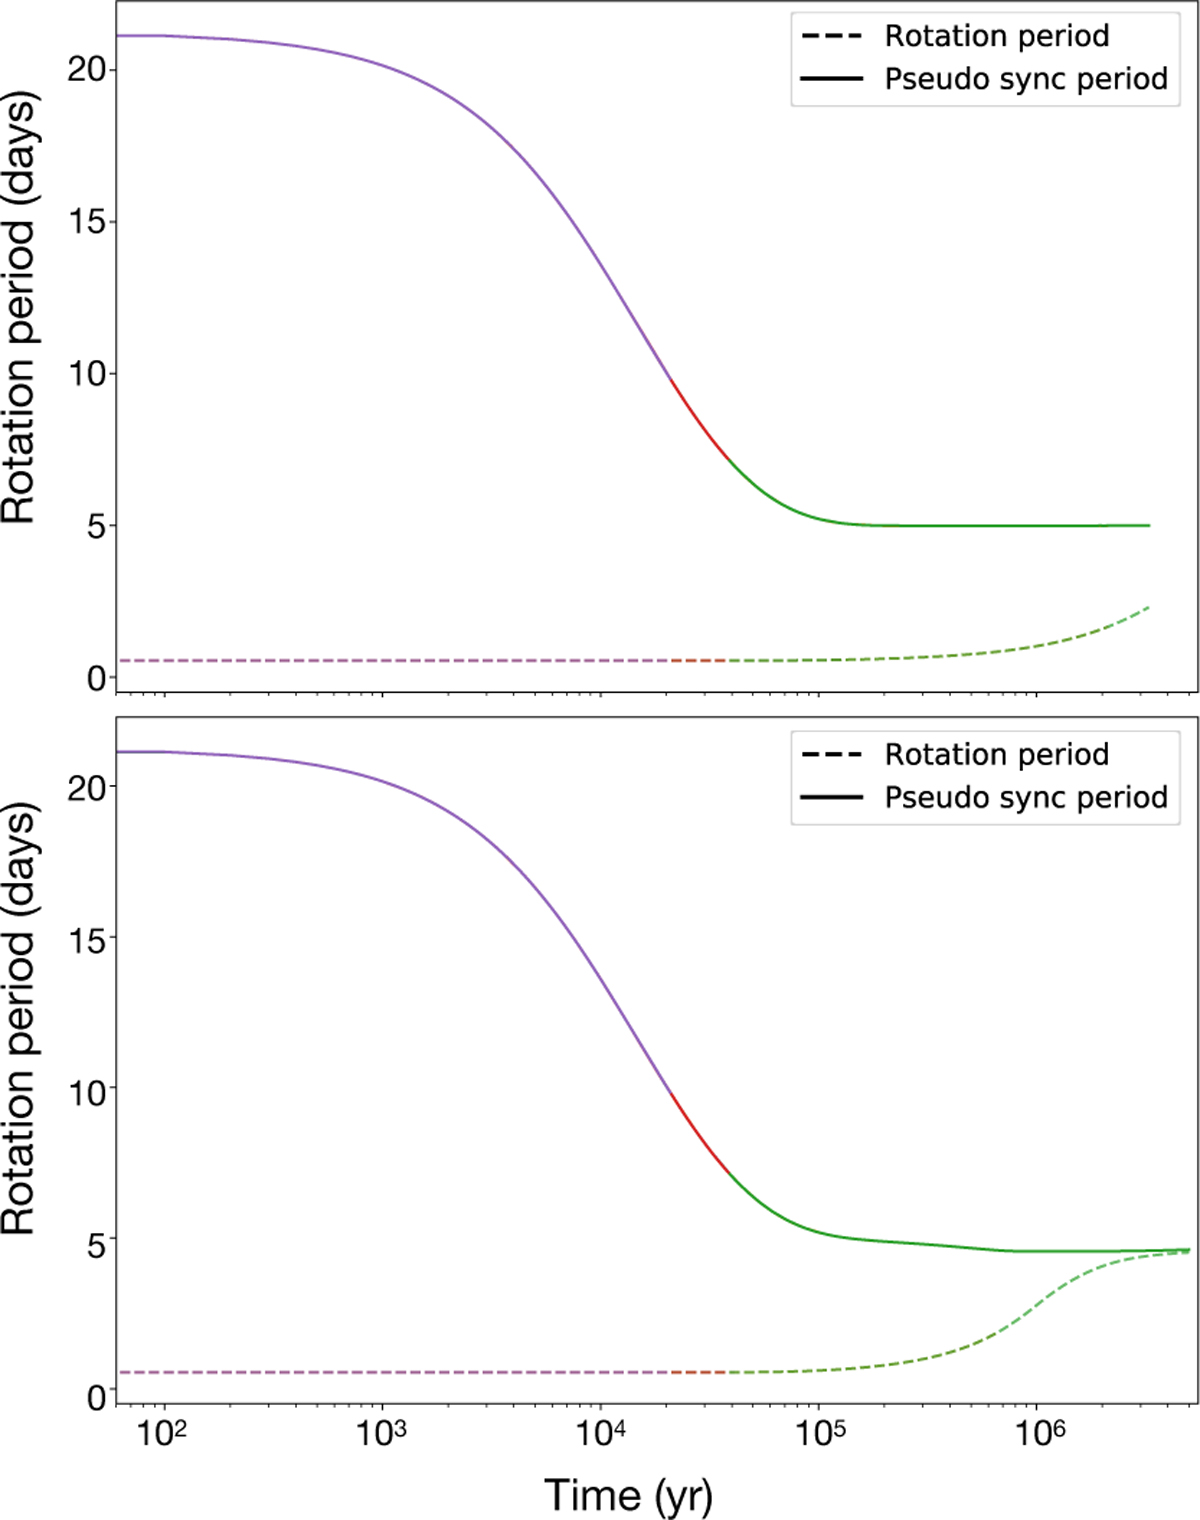
Fig. C.1
Download original image
Rotation period of the planet (dashed lines) and pseudo-synchronization period (solid lines) as a function of time. The top panel corresponds to the simulation of Figure 4: τdisk = 3 × 10⁴ yr, 1 MIo, equilibrium tide only. The bottom panel corresponds to τdisk = 3 × 10⁴ yr, 1 MIo, initial stellar rotation of 8 day and the dynamical tide is on in both star and planet. The different colors correspond to the different satellite initial semimajor axes. They are all superimposed and the green one corresponds at an initial satellite semimajor axis of 0.6 aIo.
Current usage metrics show cumulative count of Article Views (full-text article views including HTML views, PDF and ePub downloads, according to the available data) and Abstracts Views on Vision4Press platform.
Data correspond to usage on the plateform after 2015. The current usage metrics is available 48-96 hours after online publication and is updated daily on week days.
Initial download of the metrics may take a while.