Fig. 4
Download original image
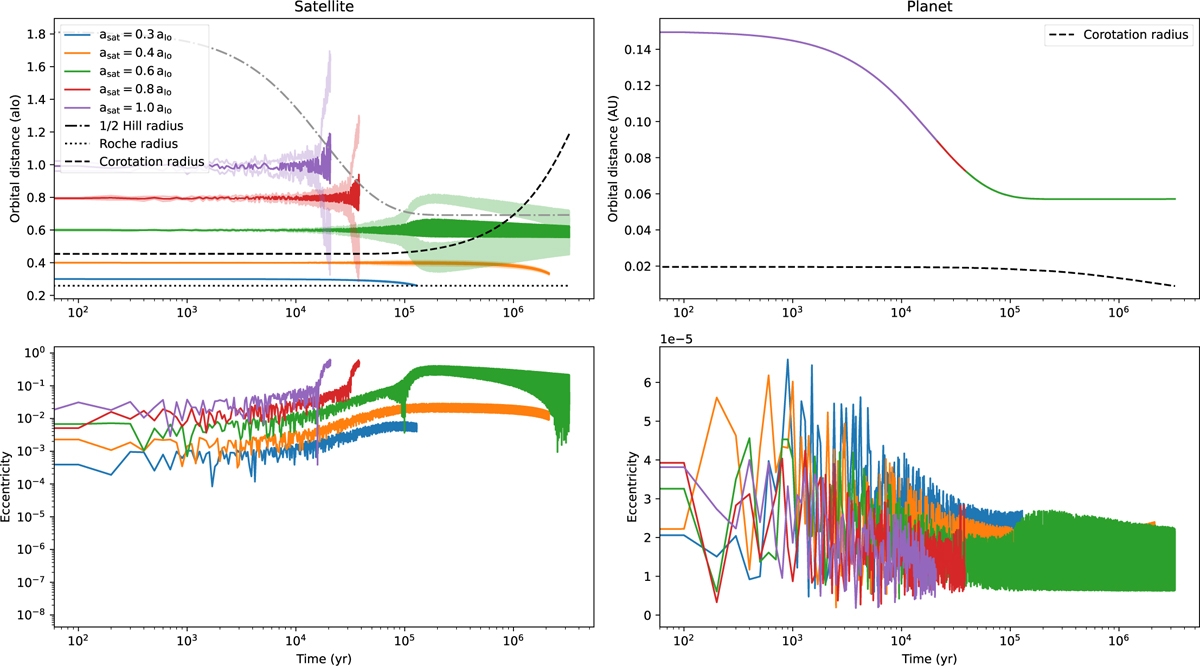
Evolution of a 1 MIo satellite orbiting a migrating Jupiter-mass planet for different initial distances of the satellite. Here the disk lifetime is 3 × 10⁴ yr, the initial rotation period of the star is 1 day and the dissipation in the satellite is taken to be 0. The top left panel shows the evolution of the semimajor axis of the satellite (solid colored lines); the shaded colored lines represent the periastron and apoastron. The gray dotted line represents the radius of the planet, the black dash-dotted line represents the Roche radius, the black dashed line the corotation radius (where the satellite’s mean motion is equal to the spin of the planet), and the gray dashed line represents one-half of the Hill radius of the planet. The bottom left panel shows the evolution of the satellite’s eccentricity. The top right panel shows the evolution of the semimajor axis of the planet (solid colored lines). The black dashed line represents the corotation radius (where the planet’s mean motion is equal to the spin of the star). The bottom left panel shows the evolution of the planet’s eccentricity.
Current usage metrics show cumulative count of Article Views (full-text article views including HTML views, PDF and ePub downloads, according to the available data) and Abstracts Views on Vision4Press platform.
Data correspond to usage on the plateform after 2015. The current usage metrics is available 48-96 hours after online publication and is updated daily on week days.
Initial download of the metrics may take a while.