Fig. 1
Download original image
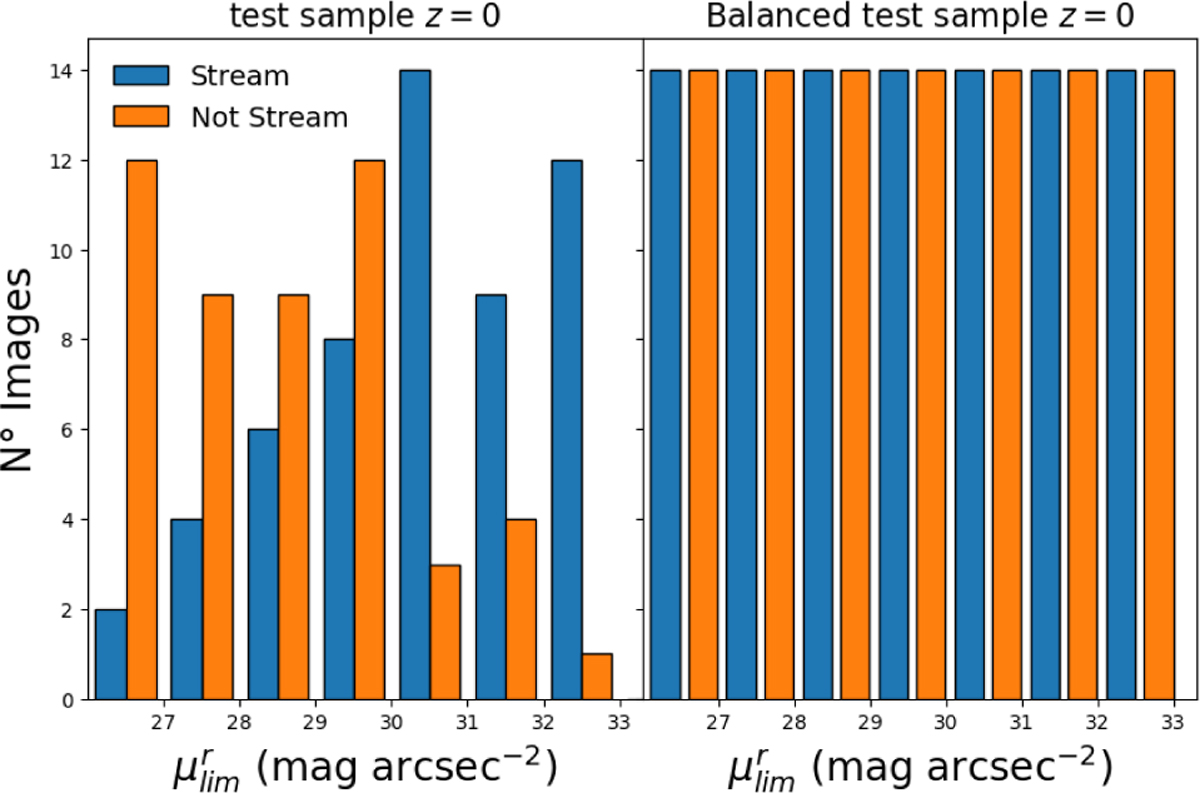
Example of data augmentation applied to the test sample of images with and without stellar streams. The left panel shows the original test sample distribution at z = 0, where images are unevenly distributed across SB limits (![]() ) for stream and non-stream classifications. After the data augmentation, the right panel illustrates the balanced test sample, ensuring an equal number of images for each class across all surface brightness limits.
) for stream and non-stream classifications. After the data augmentation, the right panel illustrates the balanced test sample, ensuring an equal number of images for each class across all surface brightness limits.
Current usage metrics show cumulative count of Article Views (full-text article views including HTML views, PDF and ePub downloads, according to the available data) and Abstracts Views on Vision4Press platform.
Data correspond to usage on the plateform after 2015. The current usage metrics is available 48-96 hours after online publication and is updated daily on week days.
Initial download of the metrics may take a while.