Open Access
Fig. 13
Download original image
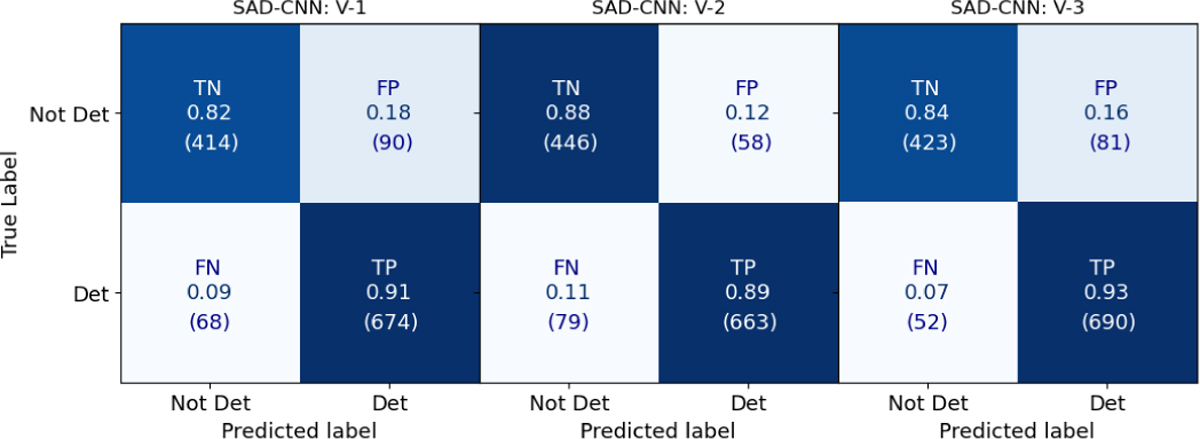
Confusion matrices of the results of the different versions of the SAD-CNN. The tree panels present each version. The rows inside the matrix represent the true labels of the galaxies. Meanwhile, the columns represent the predicted labels of the model.
Current usage metrics show cumulative count of Article Views (full-text article views including HTML views, PDF and ePub downloads, according to the available data) and Abstracts Views on Vision4Press platform.
Data correspond to usage on the plateform after 2015. The current usage metrics is available 48-96 hours after online publication and is updated daily on week days.
Initial download of the metrics may take a while.