Fig. 14
Download original image
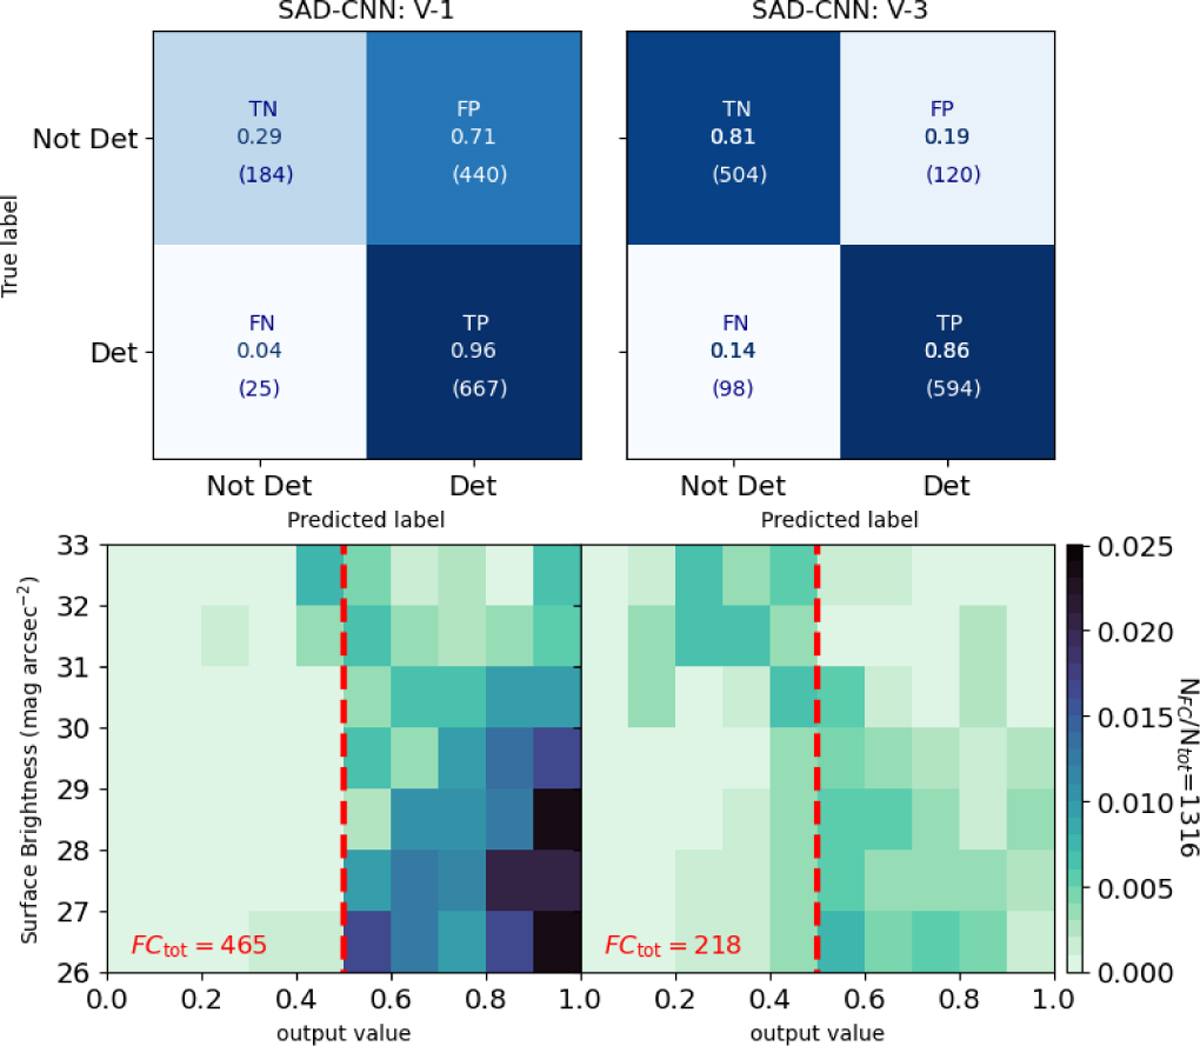
Top panels: confusion matrices comparing the performance of SAD-CNN version 1 (left) and version 3 (right) on an independent test set of inclined galaxy halos, not used during training. The normalised fractions rates are shown together with the total number of predictions in each quadrant (in parenthesis). The rows inside the matrix represent the true labels of the galaxies, meanwhile, the columns represent the predicted labels of the model. Bottom panels: false classification density maps (FP + FN) as a function of CNN output value and surface brightness (![]() ). Each panel is normalised by the total number of false cases in V-1. The red dashed line marks the decision threshold at 0.5. The total number of false cases (FCtot) is indicated in red in each panel. In V-1 was FCtot = 465 used to normalise the distributions, and the V-3 present FCtot = 218. This version shows a clear reduction in the number of false positives, especially in the surface brightness range
). Each panel is normalised by the total number of false cases in V-1. The red dashed line marks the decision threshold at 0.5. The total number of false cases (FCtot) is indicated in red in each panel. In V-1 was FCtot = 465 used to normalise the distributions, and the V-3 present FCtot = 218. This version shows a clear reduction in the number of false positives, especially in the surface brightness range ![]() ~ 28-30 mag arcsec−2, showing an improvement in performance compared to its predecessor.
~ 28-30 mag arcsec−2, showing an improvement in performance compared to its predecessor.
Current usage metrics show cumulative count of Article Views (full-text article views including HTML views, PDF and ePub downloads, according to the available data) and Abstracts Views on Vision4Press platform.
Data correspond to usage on the plateform after 2015. The current usage metrics is available 48-96 hours after online publication and is updated daily on week days.
Initial download of the metrics may take a while.