Fig. 15
Download original image
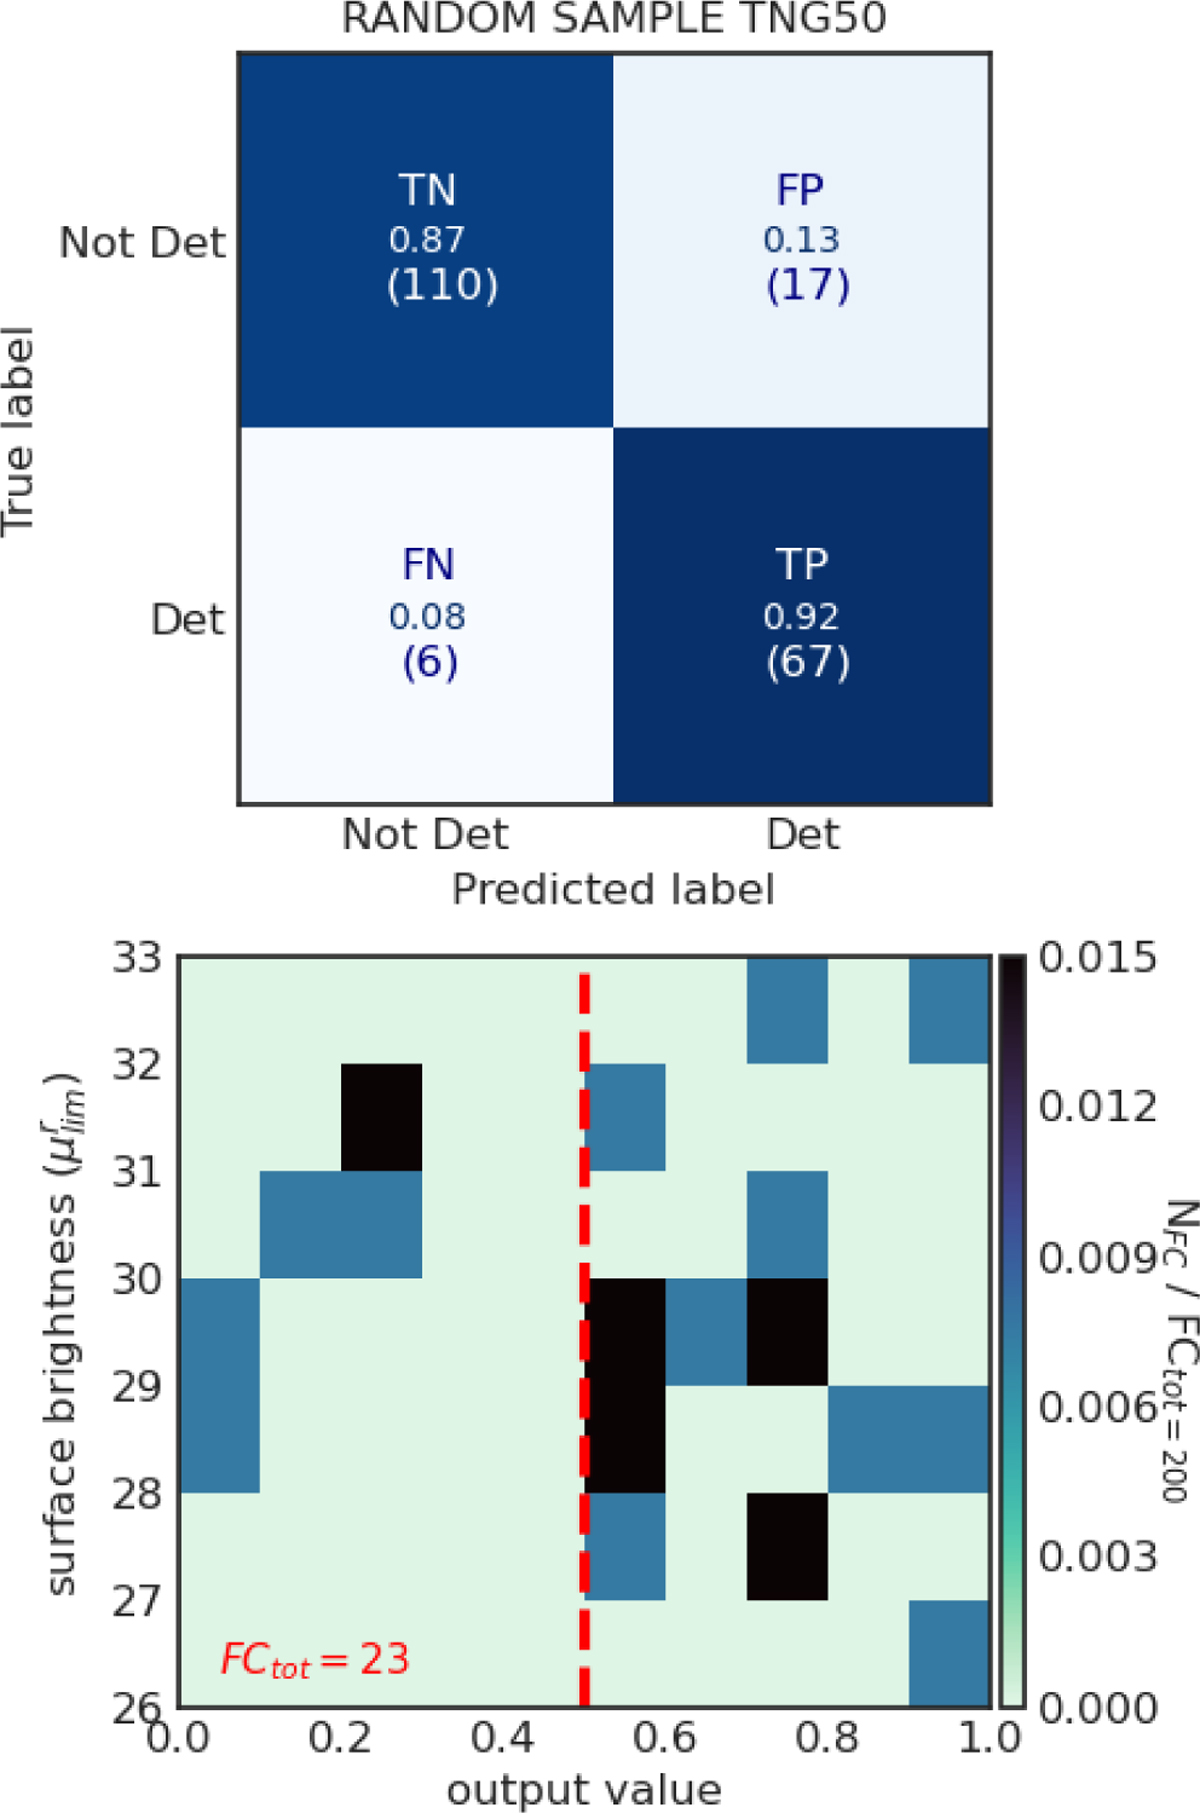
Top panel: confusion matrix showing the performance of SAD-CNN V-3 on a random sample of 200 halos from the Illustris TNG50 simulation. Each halo image has a randomly assigned surface brightness distribution and orientation. The numbers in parenthesis indicate the absolute count of each classification result. Lower panel: density map of false cases (FP+FN) as a function of the V-3 output value and the surface brightness limit (![]() ). The red dashed line marks the decision threshold at 0.5. The total number of false cases is noted in red (FCtot = 23). The density is normalised to the total number of false cases.
). The red dashed line marks the decision threshold at 0.5. The total number of false cases is noted in red (FCtot = 23). The density is normalised to the total number of false cases.
Current usage metrics show cumulative count of Article Views (full-text article views including HTML views, PDF and ePub downloads, according to the available data) and Abstracts Views on Vision4Press platform.
Data correspond to usage on the plateform after 2015. The current usage metrics is available 48-96 hours after online publication and is updated daily on week days.
Initial download of the metrics may take a while.