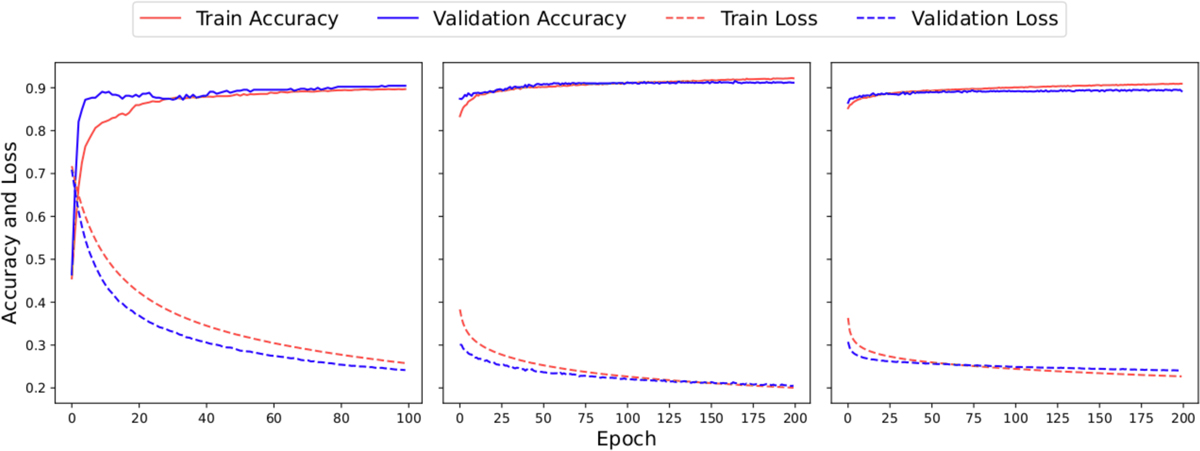
Fig. A.1
Download original image
Learning curves for the different versions of the SAD-CNN training process, panels correspond V-1, V-2, and V-3 respectively. The plot illustrates the model’s performance during training and validation for each network version. The x-axis represents the number of epochs, while the y-axis indicates the loss function values. The curves demonstrate how the model’s error decreases over time for both the training (red lines) and validation (blue lines) sets.
Current usage metrics show cumulative count of Article Views (full-text article views including HTML views, PDF and ePub downloads, according to the available data) and Abstracts Views on Vision4Press platform.
Data correspond to usage on the plateform after 2015. The current usage metrics is available 48-96 hours after online publication and is updated daily on week days.
Initial download of the metrics may take a while.