Fig. 4
Download original image
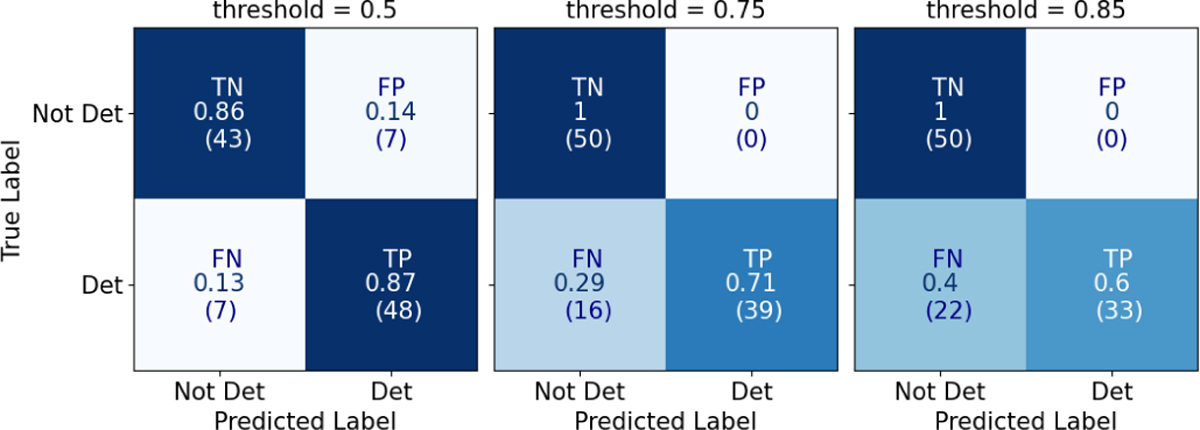
Confusion matrices for the test set of galaxies at redshift zero, evaluated with threshold values of 0.5 (left), 0.75 (middle), and 0.85 (right). Each matrix corresponds to a subset of 105 test images. The top-left cell represents the true negative rate, the top-right cell the false positive rate, the bottom-left cell the false negative rate, and the bottom-right cell the true positive rate alongside the absolute counts (in parentheses). Further details on the performance metrics are provided in Table 1.
Current usage metrics show cumulative count of Article Views (full-text article views including HTML views, PDF and ePub downloads, according to the available data) and Abstracts Views on Vision4Press platform.
Data correspond to usage on the plateform after 2015. The current usage metrics is available 48-96 hours after online publication and is updated daily on week days.
Initial download of the metrics may take a while.