Fig. 6
Download original image
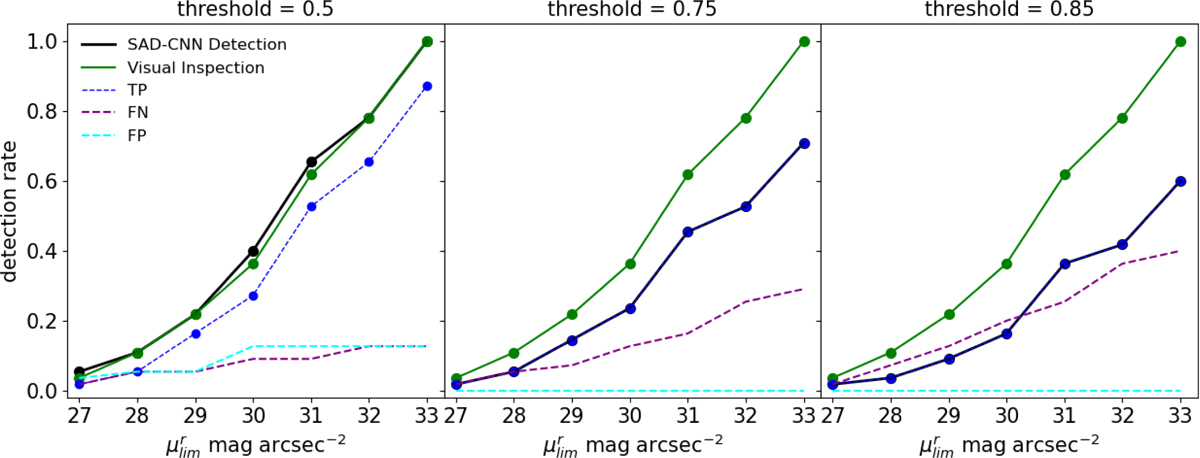
Cumulative detection rate of LSBFs for all galaxies at z = 0. The black line represents the cumulative detection rate by SAD-CNN, while the green line corresponds to cumulative detection rate from visual inspection. The blue dashed line shows the cumulative fraction of only the true positive cases. The purple dashed line is the cumulative fraction rate produced with false negative cases, while the cyan dashed line corresponds to false positive detections. An over-detection trend is noticeable at SB limits fainter than ≈29 mag arcsec−2, which remains consistent across different threshold levels but is slightly shifted depending on the chosen threshold.
Current usage metrics show cumulative count of Article Views (full-text article views including HTML views, PDF and ePub downloads, according to the available data) and Abstracts Views on Vision4Press platform.
Data correspond to usage on the plateform after 2015. The current usage metrics is available 48-96 hours after online publication and is updated daily on week days.
Initial download of the metrics may take a while.