Fig. 7
Download original image
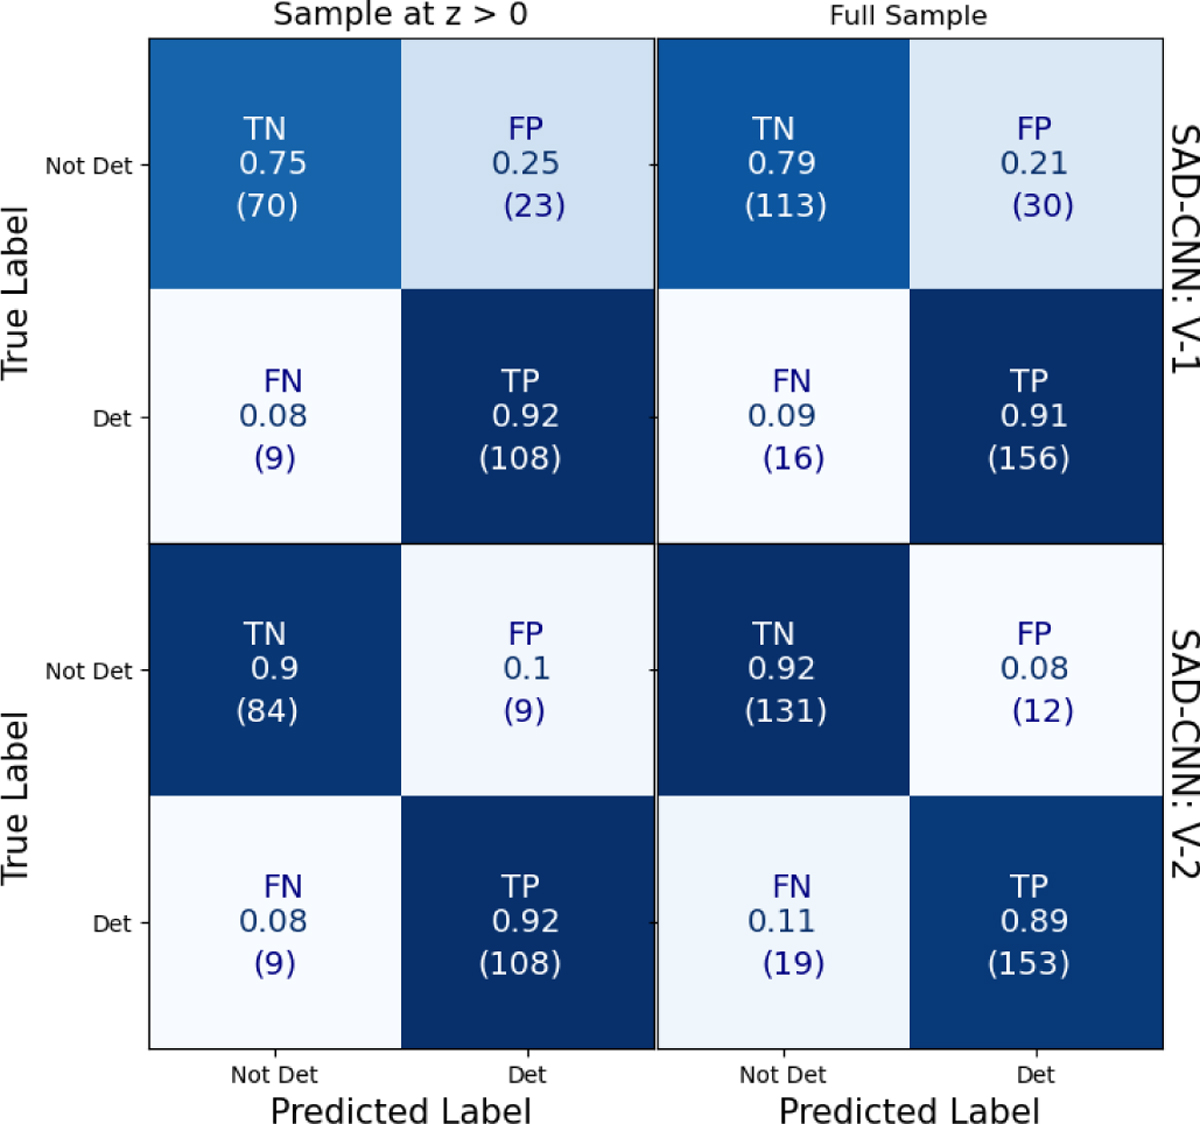
Confusion matrices for SAD-CNN V-1 and V-2. The matrices on the left represent performance on the test sample at z > 0, while those on the right combine results from test samples. True negative (TN), false positive (FP), false negative (FN), and true positive (TP) rates are shown alongside the absolute counts (in parentheses). SAD-CNN V-2 demonstrates improved performance, particularly in reducing false positives (FP), as seen in the balanced predictions for both test scenarios.
Current usage metrics show cumulative count of Article Views (full-text article views including HTML views, PDF and ePub downloads, according to the available data) and Abstracts Views on Vision4Press platform.
Data correspond to usage on the plateform after 2015. The current usage metrics is available 48-96 hours after online publication and is updated daily on week days.
Initial download of the metrics may take a while.