Fig. 8
Download original image
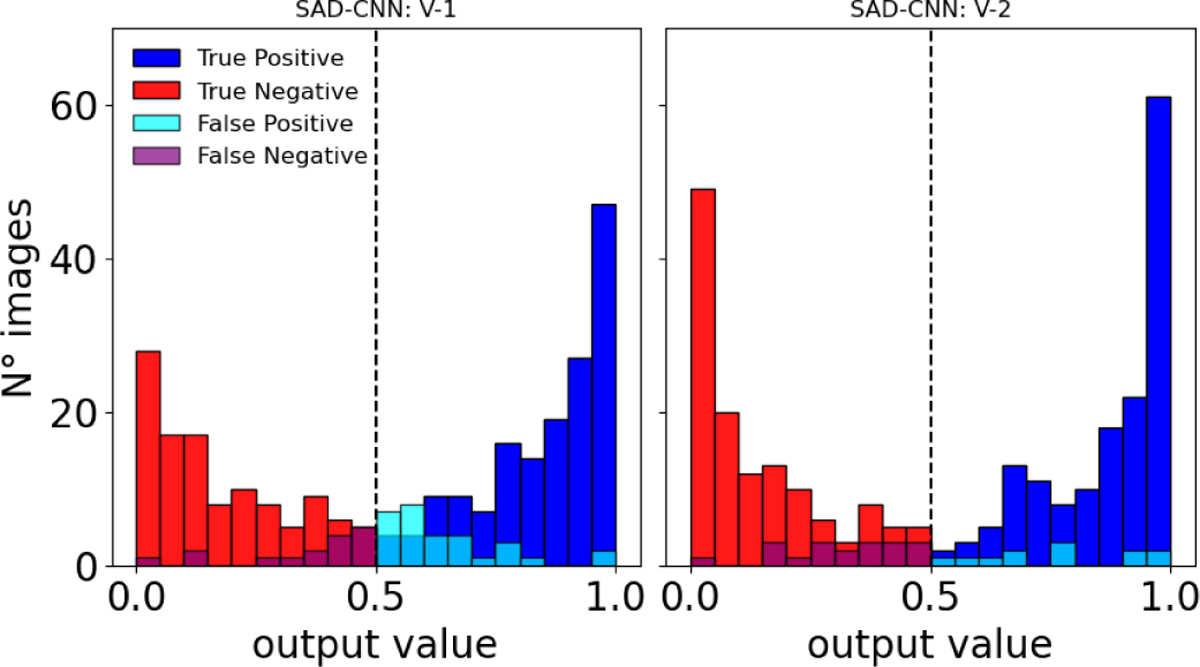
Distribution of the prediction values of the first and second versions of the SAD-CNNs, shown in each panel, respectively. The threshold value used in these distributions is 0.5 and is indicated by the dashed line. Each panel includes values from the test sets of Groups I and II. The red distribution shows all true negative cases for each SAD-CNN version. The purple distribution shows the false negative cases. The blue distribution shows all detection by the SAD-CNN or the true positive. False positives are present by the cyan distribution.
Current usage metrics show cumulative count of Article Views (full-text article views including HTML views, PDF and ePub downloads, according to the available data) and Abstracts Views on Vision4Press platform.
Data correspond to usage on the plateform after 2015. The current usage metrics is available 48-96 hours after online publication and is updated daily on week days.
Initial download of the metrics may take a while.