Fig. 9
Download original image
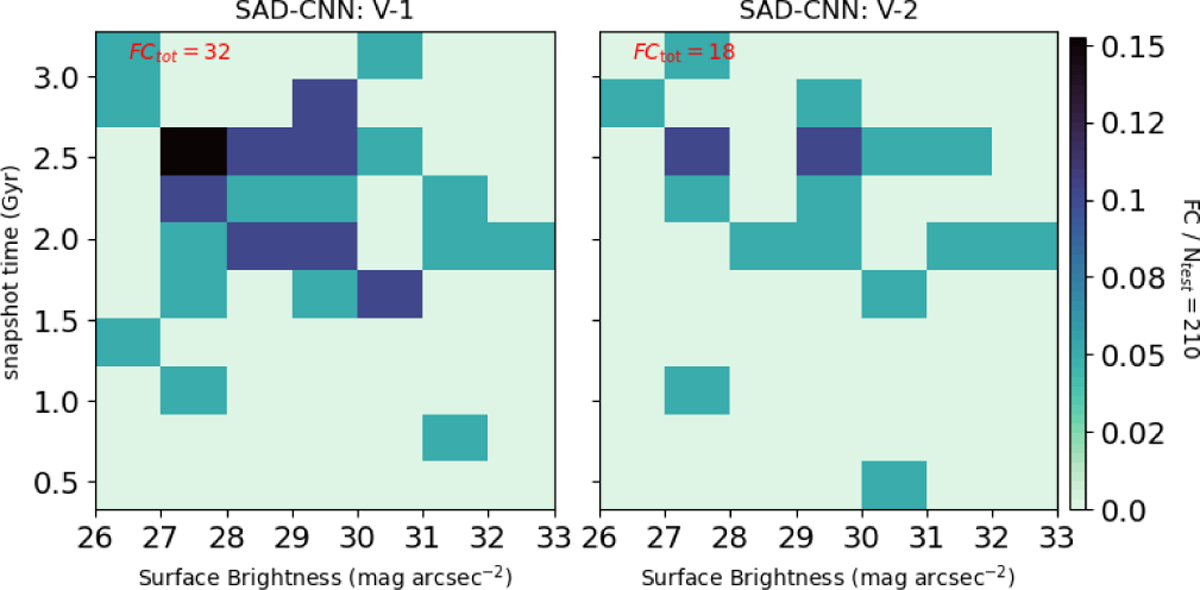
Density distribution of all false cases (FP+FN). We present the density distribution for CNN V-1 and V-2 in the panels, respectively. The false cases are analysed as a function of surface brightness and snapshot lookback time. This arrangement allows for a detailed examination of the interplay between these parameters in the context of false cases. The total number of false cases (FCtot) is 32 and 18, respectively. This is normalised with the number of false cases and the number of the test sample (210 images).
Current usage metrics show cumulative count of Article Views (full-text article views including HTML views, PDF and ePub downloads, according to the available data) and Abstracts Views on Vision4Press platform.
Data correspond to usage on the plateform after 2015. The current usage metrics is available 48-96 hours after online publication and is updated daily on week days.
Initial download of the metrics may take a while.