Fig. 1
Download original image
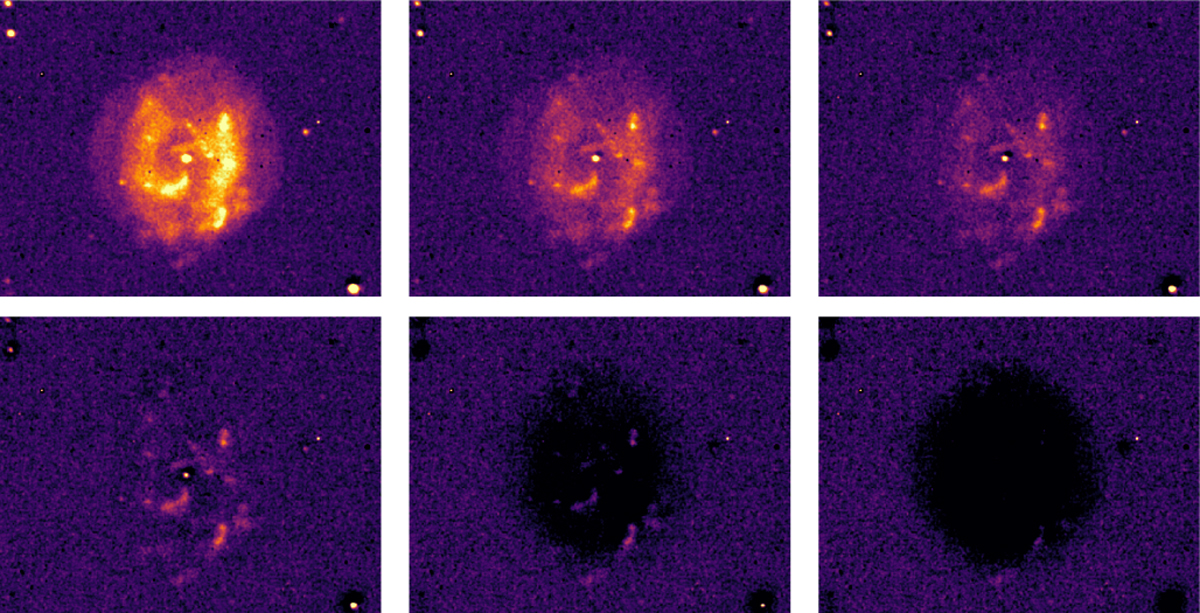
Comparison of continuum-subtracted images obtained with different scale factors. From top to bottom and left to right, the scale factor increases (0.9, 1.0, 1.05, 1.1, 1.2, 1.3). Initially, poor continuum subtraction is evident, as the field stars appear as H2 line emitters (top panels). The final two bottom panels provide clear examples of over-subtraction of the continuum.
Current usage metrics show cumulative count of Article Views (full-text article views including HTML views, PDF and ePub downloads, according to the available data) and Abstracts Views on Vision4Press platform.
Data correspond to usage on the plateform after 2015. The current usage metrics is available 48-96 hours after online publication and is updated daily on week days.
Initial download of the metrics may take a while.