Fig. 4
Download original image
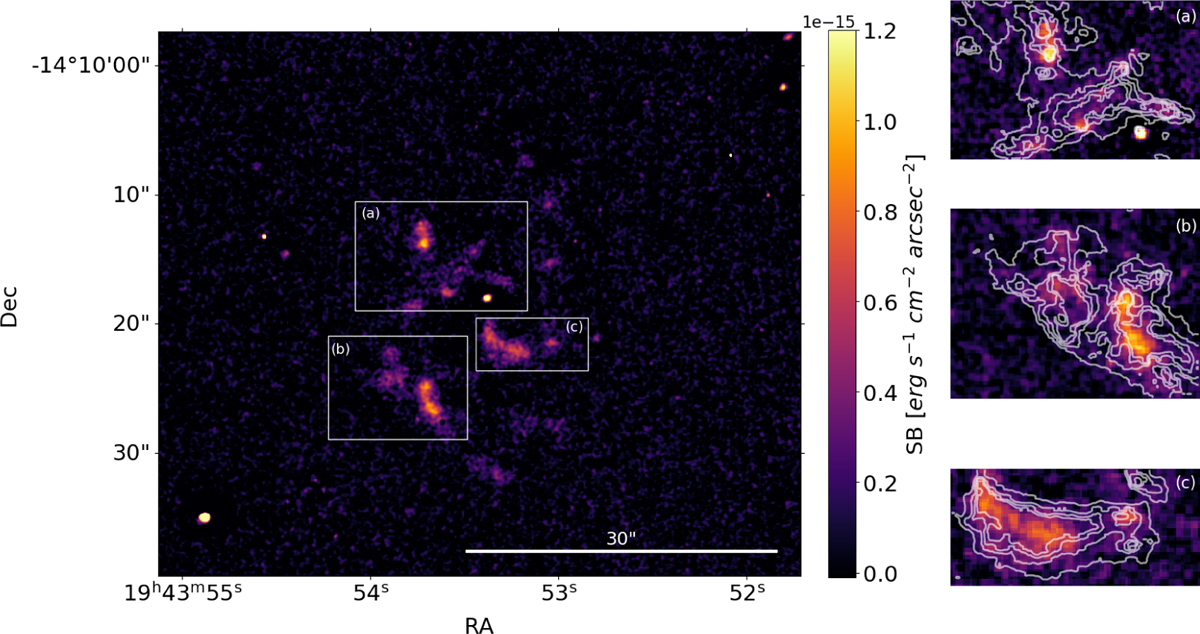
Surface brightness of the H2 1–0 S(1) continuum-subtracted image for NGC 6818 is shown in the left panel. The other panels present the H2 continuum-subtracted image overlaid with HST [N II] emission contours, highlighting three regions of the nebula: panels a and b correspond to the “mustache” structures, while panel c shows the brighter southern part of the nebula.
Current usage metrics show cumulative count of Article Views (full-text article views including HTML views, PDF and ePub downloads, according to the available data) and Abstracts Views on Vision4Press platform.
Data correspond to usage on the plateform after 2015. The current usage metrics is available 48-96 hours after online publication and is updated daily on week days.
Initial download of the metrics may take a while.