Fig. 7
Download original image
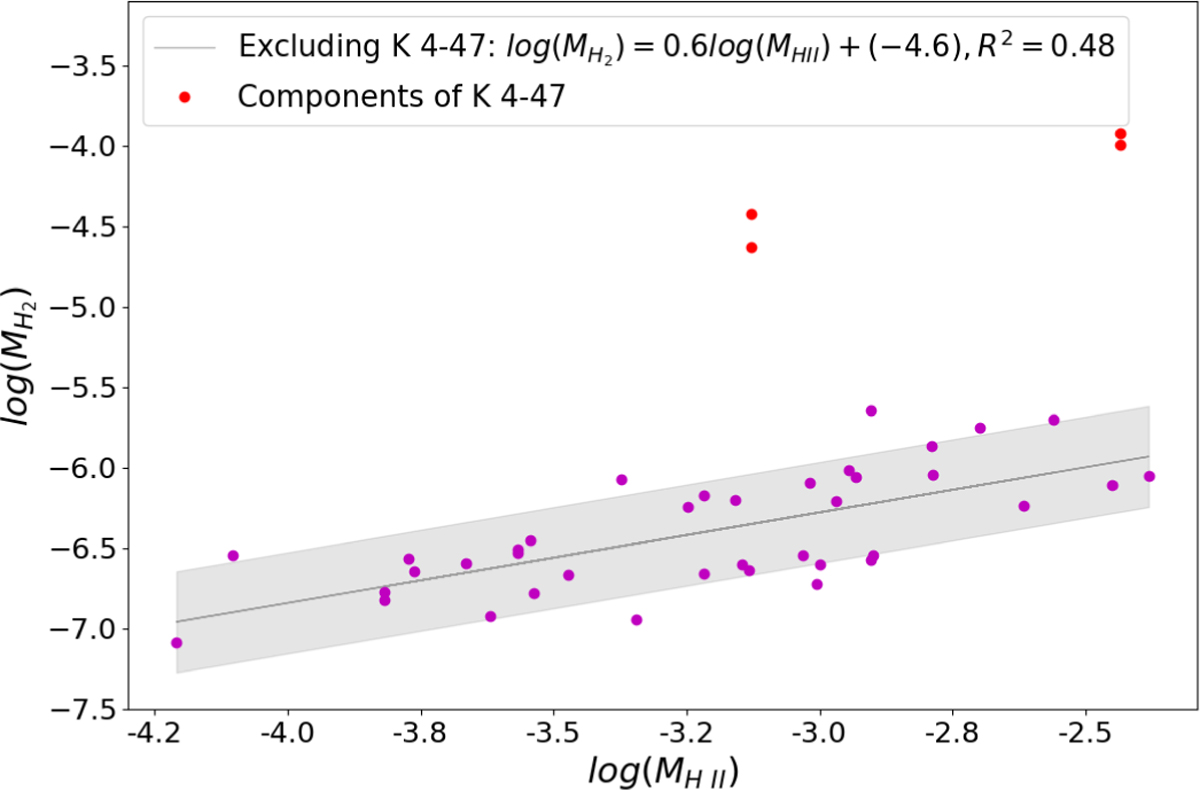
Correlation between ionized and warm molecular hydrogen mass for the LISs in NGC 7662, NGC 7009, and NGC 6543 (Akras et al. 2017, 2020). The gray shaded area represents the uncertainty of the regression line. Outflows from K 4-47 and LISs were excluded from the linear fit due to their significant deviation from the bulk. Red points correspond to these nebular components, with the more massive ones representing the outflows.
Current usage metrics show cumulative count of Article Views (full-text article views including HTML views, PDF and ePub downloads, according to the available data) and Abstracts Views on Vision4Press platform.
Data correspond to usage on the plateform after 2015. The current usage metrics is available 48-96 hours after online publication and is updated daily on week days.
Initial download of the metrics may take a while.