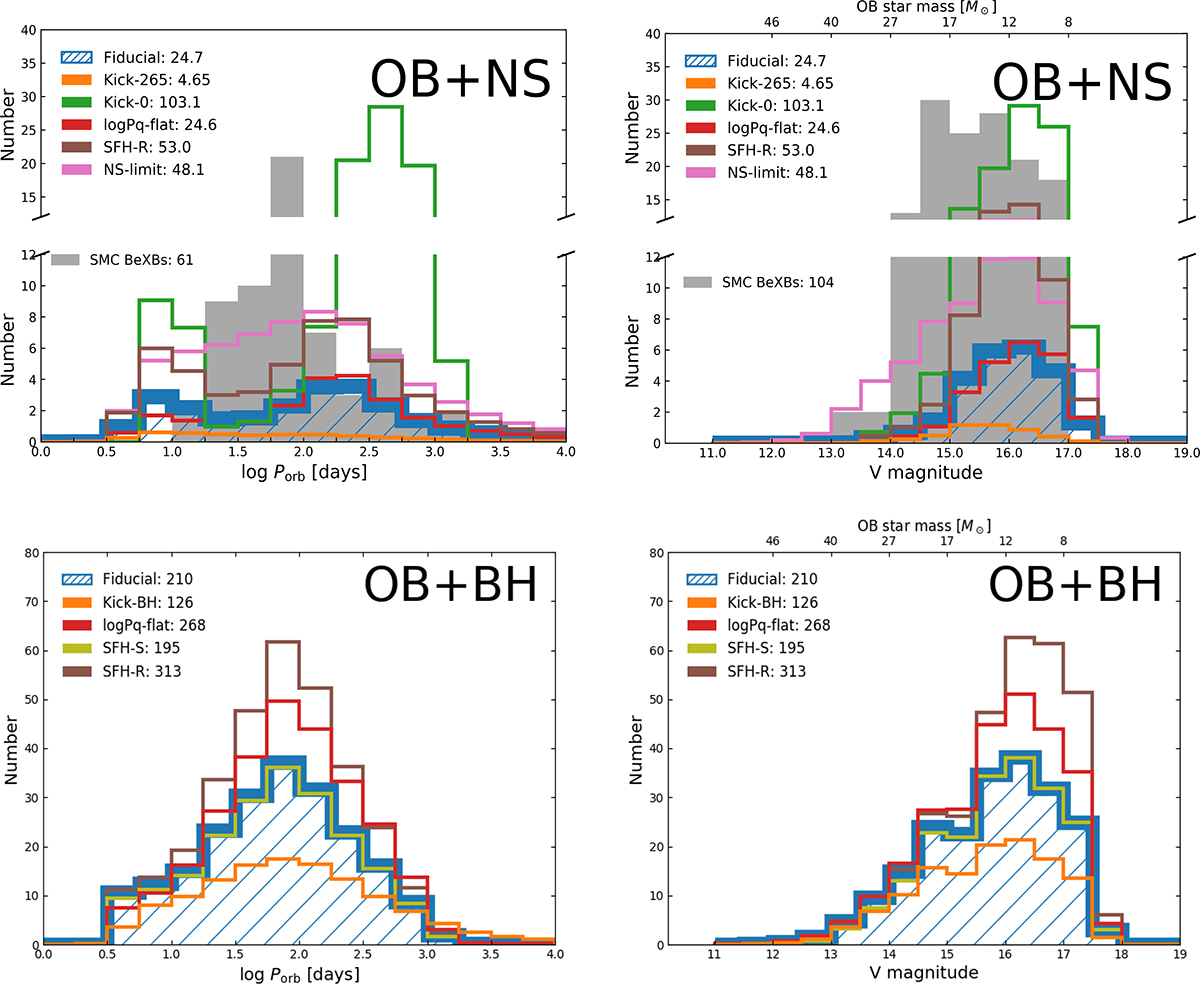
Fig. 12.
Download original image
Orbital period (left plots) and V band magnitude or mass (right) distributions of the OB+NS (top) and OB+BH (bottom) binaries resulting from our parameter variations. The predictions from the different population models are shown with differently coloured lines (see legend), where the predictions from the fiducial model are indicated by the hatched histograms with blue thick lines. The population models that produce the same distributions as the fiducial model are not shown in the corresponding plots. In the bottom plots, the SFH-R distributions are very close to the fiducial ones. We show the distributions of the observed SMC BeXBs in the upper panels with grey histograms. The observed orbital periods and V-band magnitudes of the SMC BeXBs are from Haberl & Sturm (2016).
Current usage metrics show cumulative count of Article Views (full-text article views including HTML views, PDF and ePub downloads, according to the available data) and Abstracts Views on Vision4Press platform.
Data correspond to usage on the plateform after 2015. The current usage metrics is available 48-96 hours after online publication and is updated daily on week days.
Initial download of the metrics may take a while.