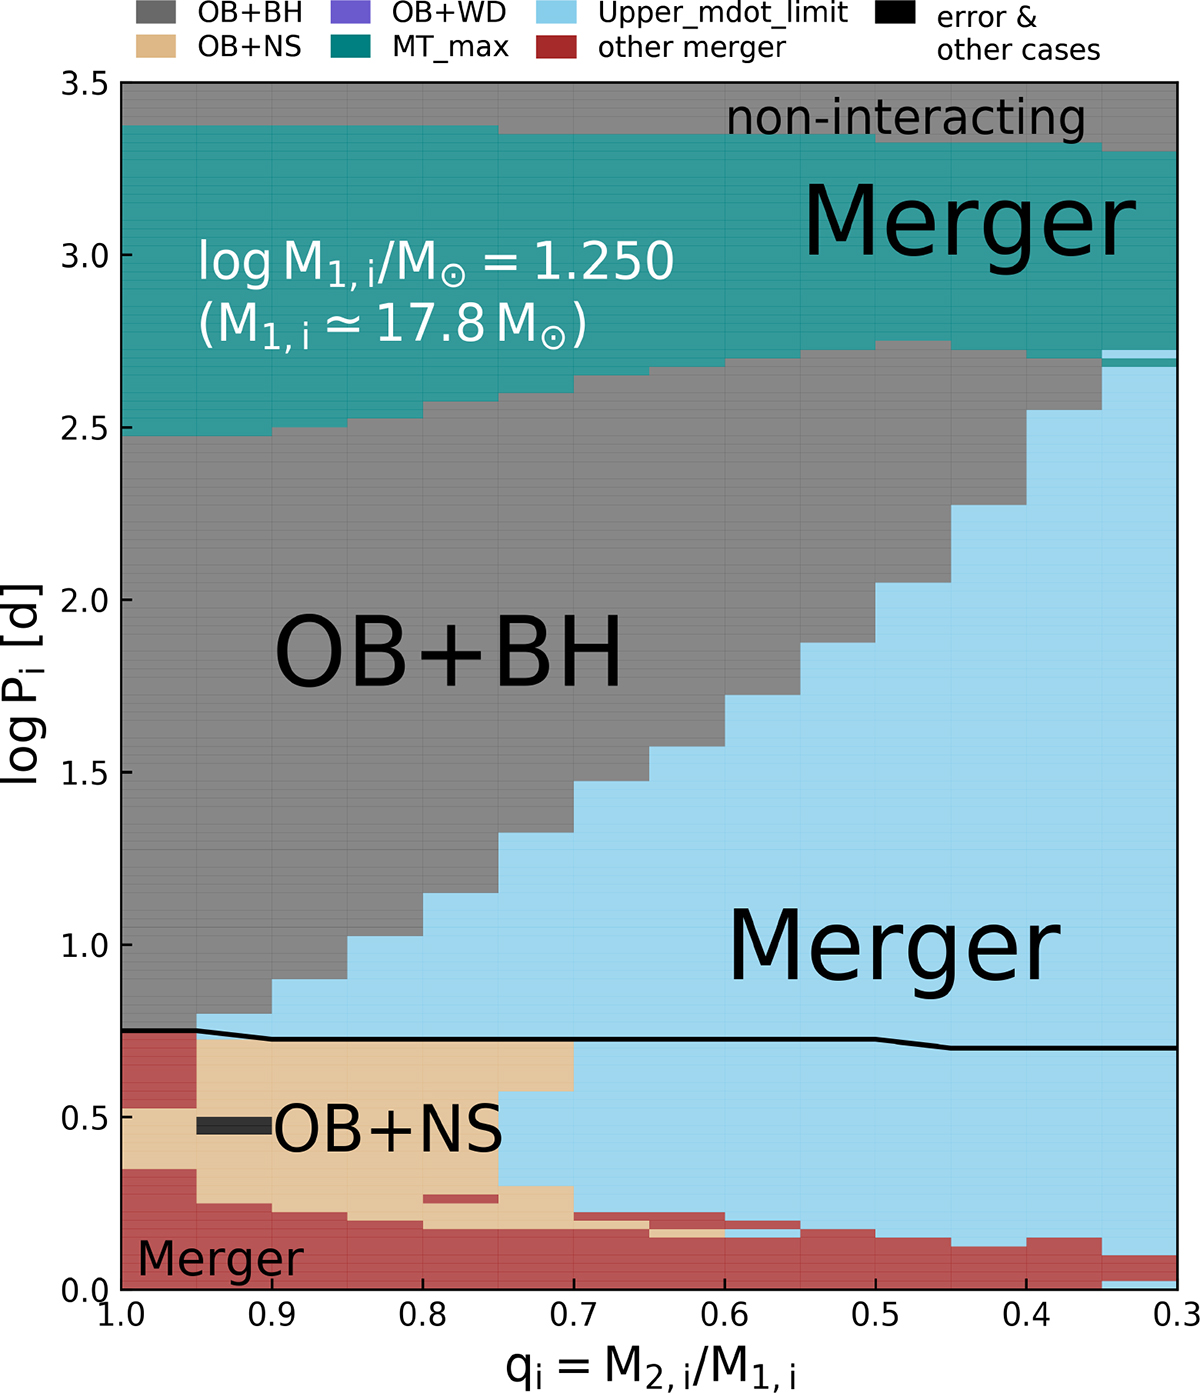
Fig. 2.
Download original image
Outcome of the first mass transfer phase in our detailed binary evolution models with an initial primary mass of 17.8 M⊙. In this figure, each pixel represents one detailed MESA binary evolution model, and the corresponding evolutionary outcome is colour-coded (see top legend). Here, ‘OB+cc’ (cc= BH, NS, WD) implies that the corresponding model produced an OB+cc phase, with the cc type indicated by the corresponding colour. However, depending on the adopted compact object birth kicks, these systems may also break up. Systems indicated as ‘Upper_mdot_limit’ or ‘MT_max’ are terminated during their first mass transfer phase as the mass transfer rate exceeds limiting values (see text) and a merger is expected, and those indicated as ‘other merger’ undergo L2-overflow in a contact situation. Corresponding plots for different initial donor star masses can be found in Appendix A.
Current usage metrics show cumulative count of Article Views (full-text article views including HTML views, PDF and ePub downloads, according to the available data) and Abstracts Views on Vision4Press platform.
Data correspond to usage on the plateform after 2015. The current usage metrics is available 48-96 hours after online publication and is updated daily on week days.
Initial download of the metrics may take a while.