Fig. 4.
Download original image
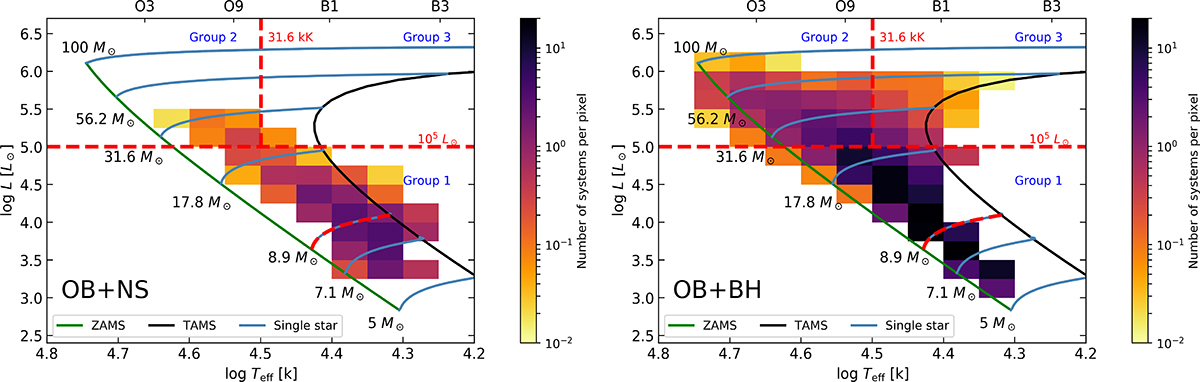
Predicted distribution of OB stars with a NS (left panel) and BH (right panel) companion in the Hertzsprung–Russell diagram. The green line is the ZAMS, and the black line is the terminal-age main sequence (TAMS). The blue lines represent evolutionary tracks of non-rotating core hydrogen burning single stars, with the indicated initial masses. The dashed red lines show the boundaries of the three groups of stars defined in the main text, i.e. Teff = 31.6 kK, log L/L⊙ = 5, and the MS evolutionary track of a 8.9 M⊙ single star. On top, we label several spectral types at their approximate effective temperature.
Current usage metrics show cumulative count of Article Views (full-text article views including HTML views, PDF and ePub downloads, according to the available data) and Abstracts Views on Vision4Press platform.
Data correspond to usage on the plateform after 2015. The current usage metrics is available 48-96 hours after online publication and is updated daily on week days.
Initial download of the metrics may take a while.