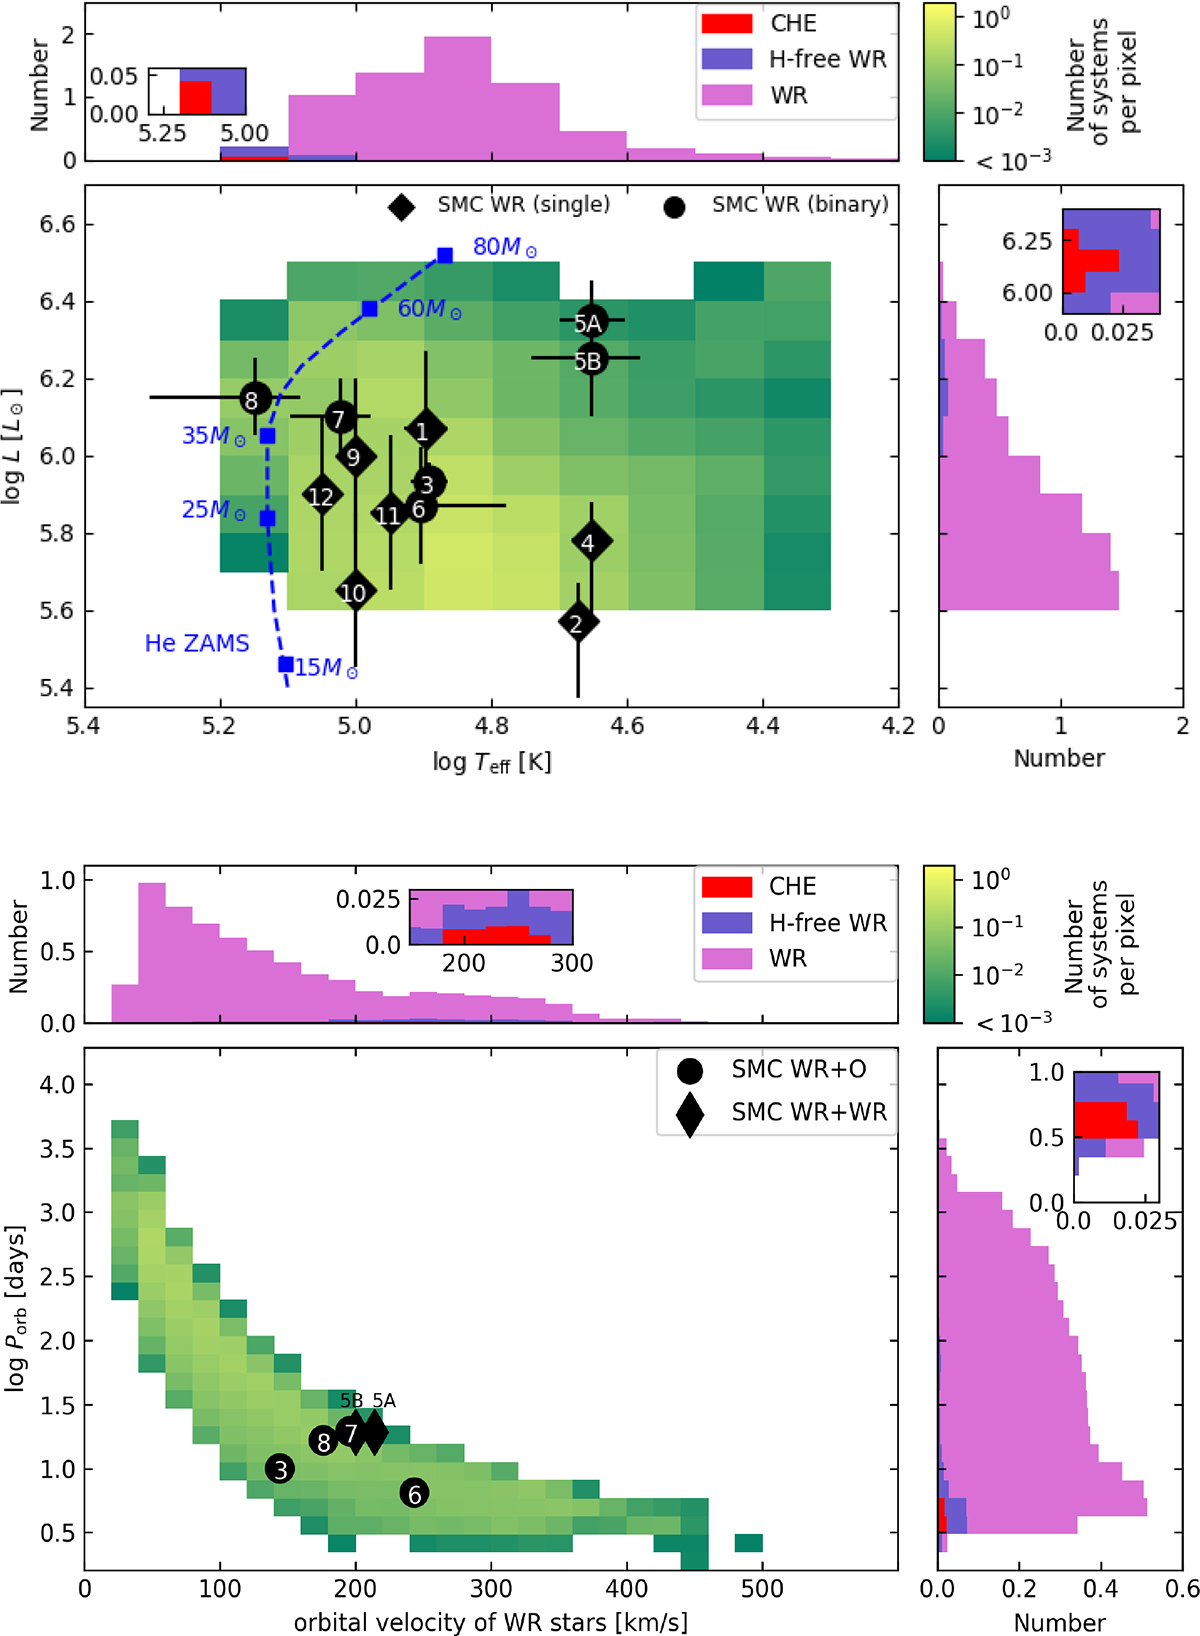
Fig. 7.
Download original image
Distributions of properties of the predicted SMC OB+WR binary population. The top panel shows the distribution of the predicted position of the WR components in the Hertzsprung Russell diagram (background colours), where the colour indicates the expected number per pixel (see colour bar on the top right). The total number of observed WR star components, or WR binaries, is four. The plots to the right and on top give the 1D-projections of the distribution, with the inset magnifying the WR binaries produced via chemical homogeneous evolution (CHE). The black circles and diamonds represent the WR components of the observed WR binaries, and single WR stars, in the SMC (Foellmi et al. 2003; Foellmi 2004; Koenigsberger et al. 2014; Hainich et al. 2015; Shenar et al. 2016, 2018), where the numbers are related to the identifier, e.g. ‘1’ for ‘SMC AB1’. The dashed blue line is the zero-age main sequence of helium star models (He-ZAMS) with SMC metallicity (Köhler et al. 2015), with the indicated helium star masses. The bottom panel shows the distribution of the predicted WR binaries in the plane of orbital period versus the orbital velocity of the WR component. Here, the black symbols represent the projected orbital velocity semi-amplitudes of the observed WR+O star binaries (circles) and of the WR+WR binary SMC AB5 (diamond).
Current usage metrics show cumulative count of Article Views (full-text article views including HTML views, PDF and ePub downloads, according to the available data) and Abstracts Views on Vision4Press platform.
Data correspond to usage on the plateform after 2015. The current usage metrics is available 48-96 hours after online publication and is updated daily on week days.
Initial download of the metrics may take a while.